Posted July 5, 2018
By Lucas Koepke
In the last blog post we analyzed user journeys. Another facet of user journeys is not at the same level of granularity as event logs and pages read, but rather at the book level. For readers who read some of at least one book, does the book genre influence whether they read again? For users who read another book, if their first book is in a certain genre, are they more or less likely to read again in that same genre or a different one? Do some genres lead to a mix of books in other genres? Do some genres primarily lead back to themselves?
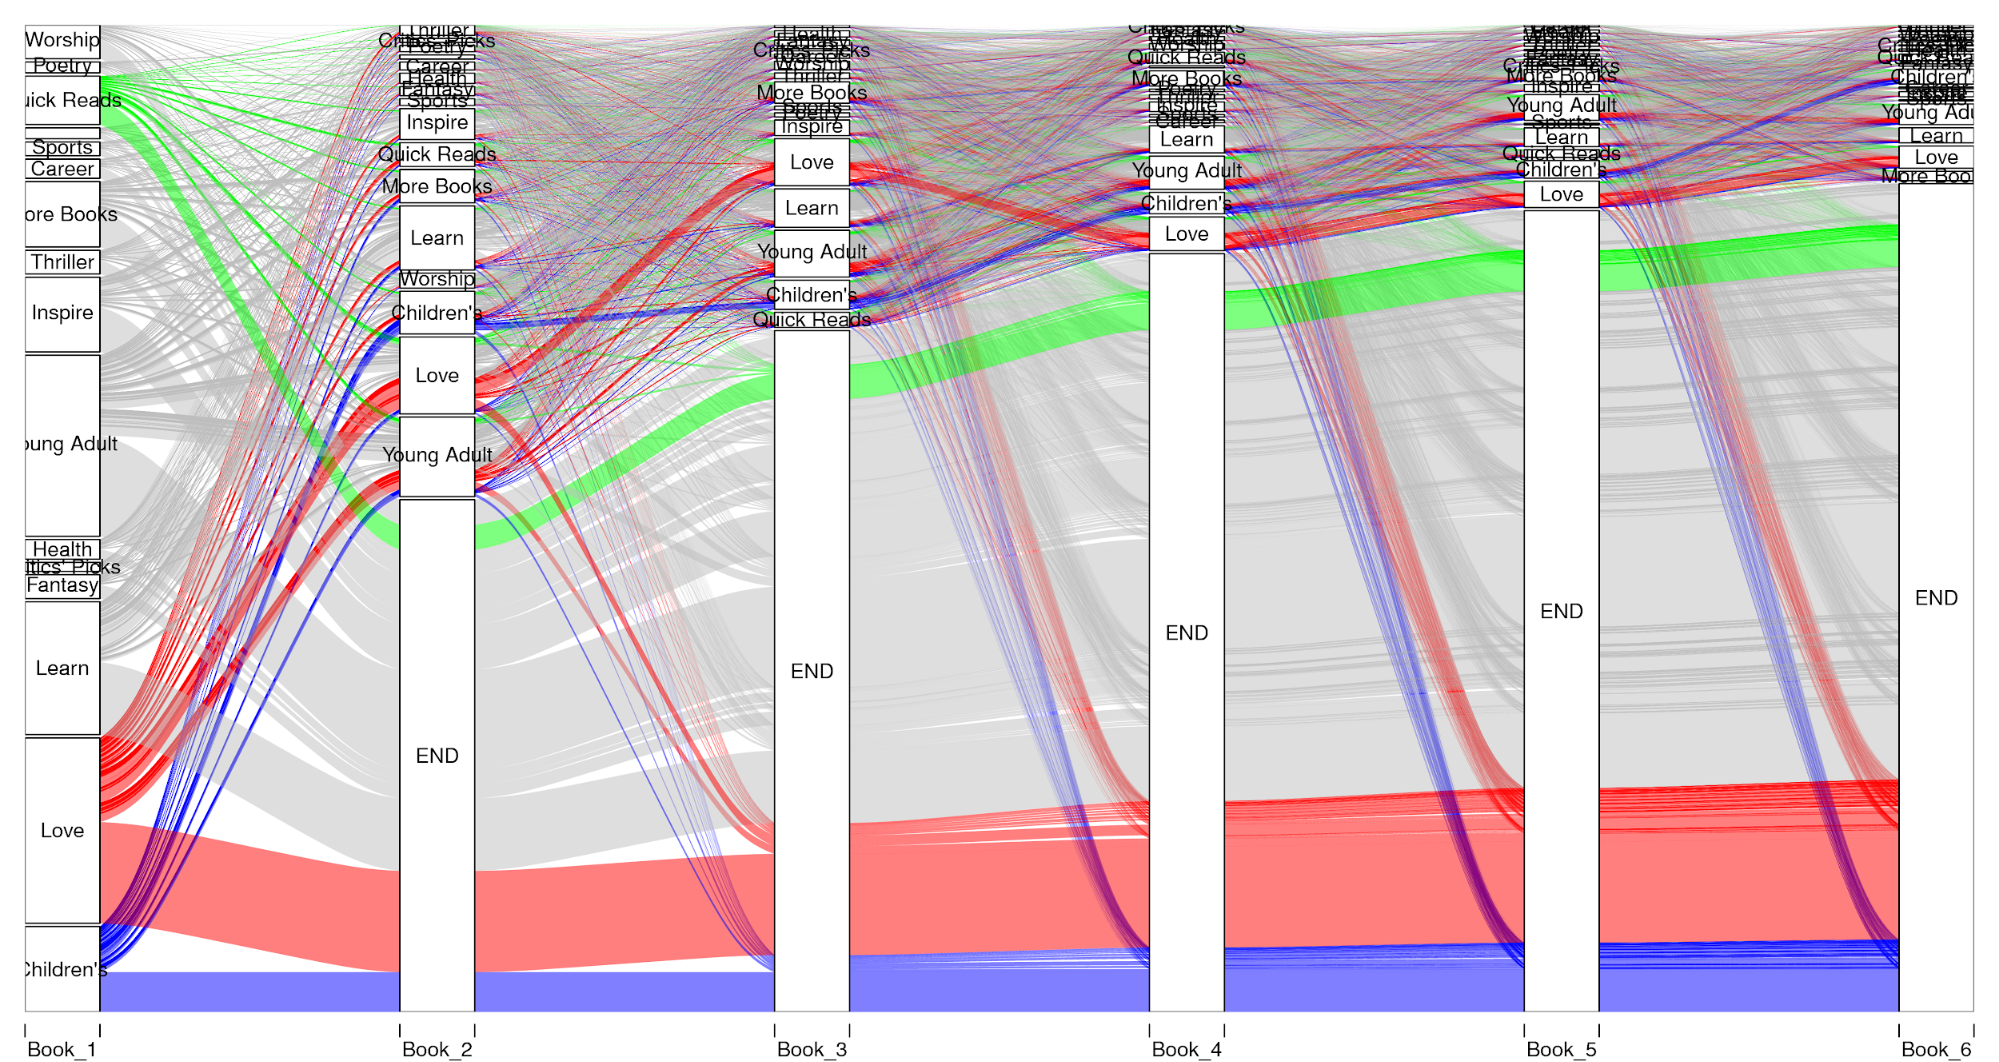
Using the recently updated table of book categories, I again used data from registered users in Nigeria to calculate the progression through the book categories for those who read 1 or more books. The plot (Figure A) is admittedly a bit rough, since it was difficult to find an easy-to-use package to make a Sankey diagram in R (the one in Plotly looks great, but the limited documentation on formatting the input data means I don’t have it working yet).
Each user starts in one book category (since this is only users who read one or more books) and from there lines are drawn to the next category, with the line width corresponding to how many users followed that path. The “END” book category is a construct to capture users who stop reading, and once a user is in the “END” category they do not leave. Three of the book categories are colored, to help track users that started in that category through the other categories.
Figure A. Genre Progression.
Visually it appears that although most readers who start in a category either read again in that same category or stop reading, there is also a lot of mixing into other categories. However, different trends do exist between the different genre. For example, it appears that the quick reads category has a much lower retention rate than the love or children’s book categories. Further analysis could be helpful in understanding what types of books help to retain Worldreader users. This brings up plenty of additional questions, such as what is the exact percentage who read again in the same category as their first for their second, third, fourth book? Do users who start in one category tend to mix subsequent books more often than those starting in different categories?
So what have we learned from the jumble of research questions, analysis approaches, graphs, and results from across these three blog posts? I’m still working that out myself, since it seems that asking one question doesn’t really lead to an answer so much as five more questions to ask. The biggest takeaway is probably that users behave in a multitude of ways, and this work is only the start to honing in on the right questions to ask of the data, and the algorithms to answer those questions. A valuable next step would be to support the backend analysis with some qualitative research to get more insight into why users display certain behaviors.