Posted June 29, 2018
By Lucas Koepke
This is the second of three posts on user behavior within the Worldreader app. Where the last post looked at general user patterns by registration status and browser [link to previous post], this post will describe a more granular exploration of user journeys. User journeys is the term we are using for the analysis of user behavior with the added component of time, not just looking at static counts and averages of user activity as before. This necessitates the construction of many additional indicators to capture this extra detail, while at the same time carefully considering the computational cost of each one. Although this section has received a lot of analytical work, results are still mostly elusive. This is partly due to data issues, since these indicators are more specific than basic summaries, any problems with the data crop up quicker and more directly than before. Changing data also means computational challenges, and since these indicators are time-consuming to compute anyways, doing so multiple times compounds the problem.
However, probably the most significant reason for fewer results just yet is the general complexity of adding the time component into user behavior analysis. Some indicators are easier to compute, such as the time between the first log event and the first page read, but computational difficulty increases quickly from there. The added time needed to compute these indicators means that for this section, we are currently using data from just one country, Nigeria.
The first step was to generate a list of potential indicators to create from the log data, that would capture relevant features and could then be compared between users. There is a mix of time-dependent and summary indicators here, with the idea being that relationships between these may help us understand user behavior.
| Time on platform | Total time between first and last event logged |
| Events to first page read | Number of events before the first page is read |
| Time to first page read | Time between first event logged and first page read |
| Time to second page | Time between first page read and the second page read (if 2+ pages read) |
| Time to third page | Time between second and third page read (if 3+ pages read) |
| Time to second book | Elapsed time between the first page read in the first book, to the first page read in the second book (if 2+ books read) |
| Unique books logged | Number of unique books logged, includes books viewed but not necessarily read |
| Unique books read | Number of unique books with 1+ page read |
| Book completion rate | Average completion percent of books read |
| Book continuity | Average of the continuity percent for each book read (see description below) |
The book completion rate is meant to be a measure of how far a user typically reads through books. Part of the data logged when a page is read is the page (chunk) number the user requests, and since the chunks are a fixed size, the percent progress through the book is known for each page number. This variable simply takes the average of the maximum for each book read.
The book continuity variable is a work in progress, and is meant to complement the book completion rate, since that variable does not depend on how much of the book a user read before stopping. If a user only read the last page of a book, for example, they “completed” the book by that metric, but that’s not the whole picture. Currently, this variable is computed in two stages. First, for each book a user reads, the number of unique page numbers read is divided by the maximum page number reached. A value for a book of 100% means they read each page up to their maximum page read, even if that maximum page is not the last page of the book. Second, the average is computed for each user over all the books they read.
There are a few secondary indicators that are further derived from these computed indicators. These include true/false variables for whether a user read a page within their first 5, 10, or 25 log events, and also if their total time on the platform was less than 5, 10, 30, or 60 minutes, or 24 hours. Lastly, we computed the ratio of page read events to total events, as a measure of the density of reading versus other actions on the app.
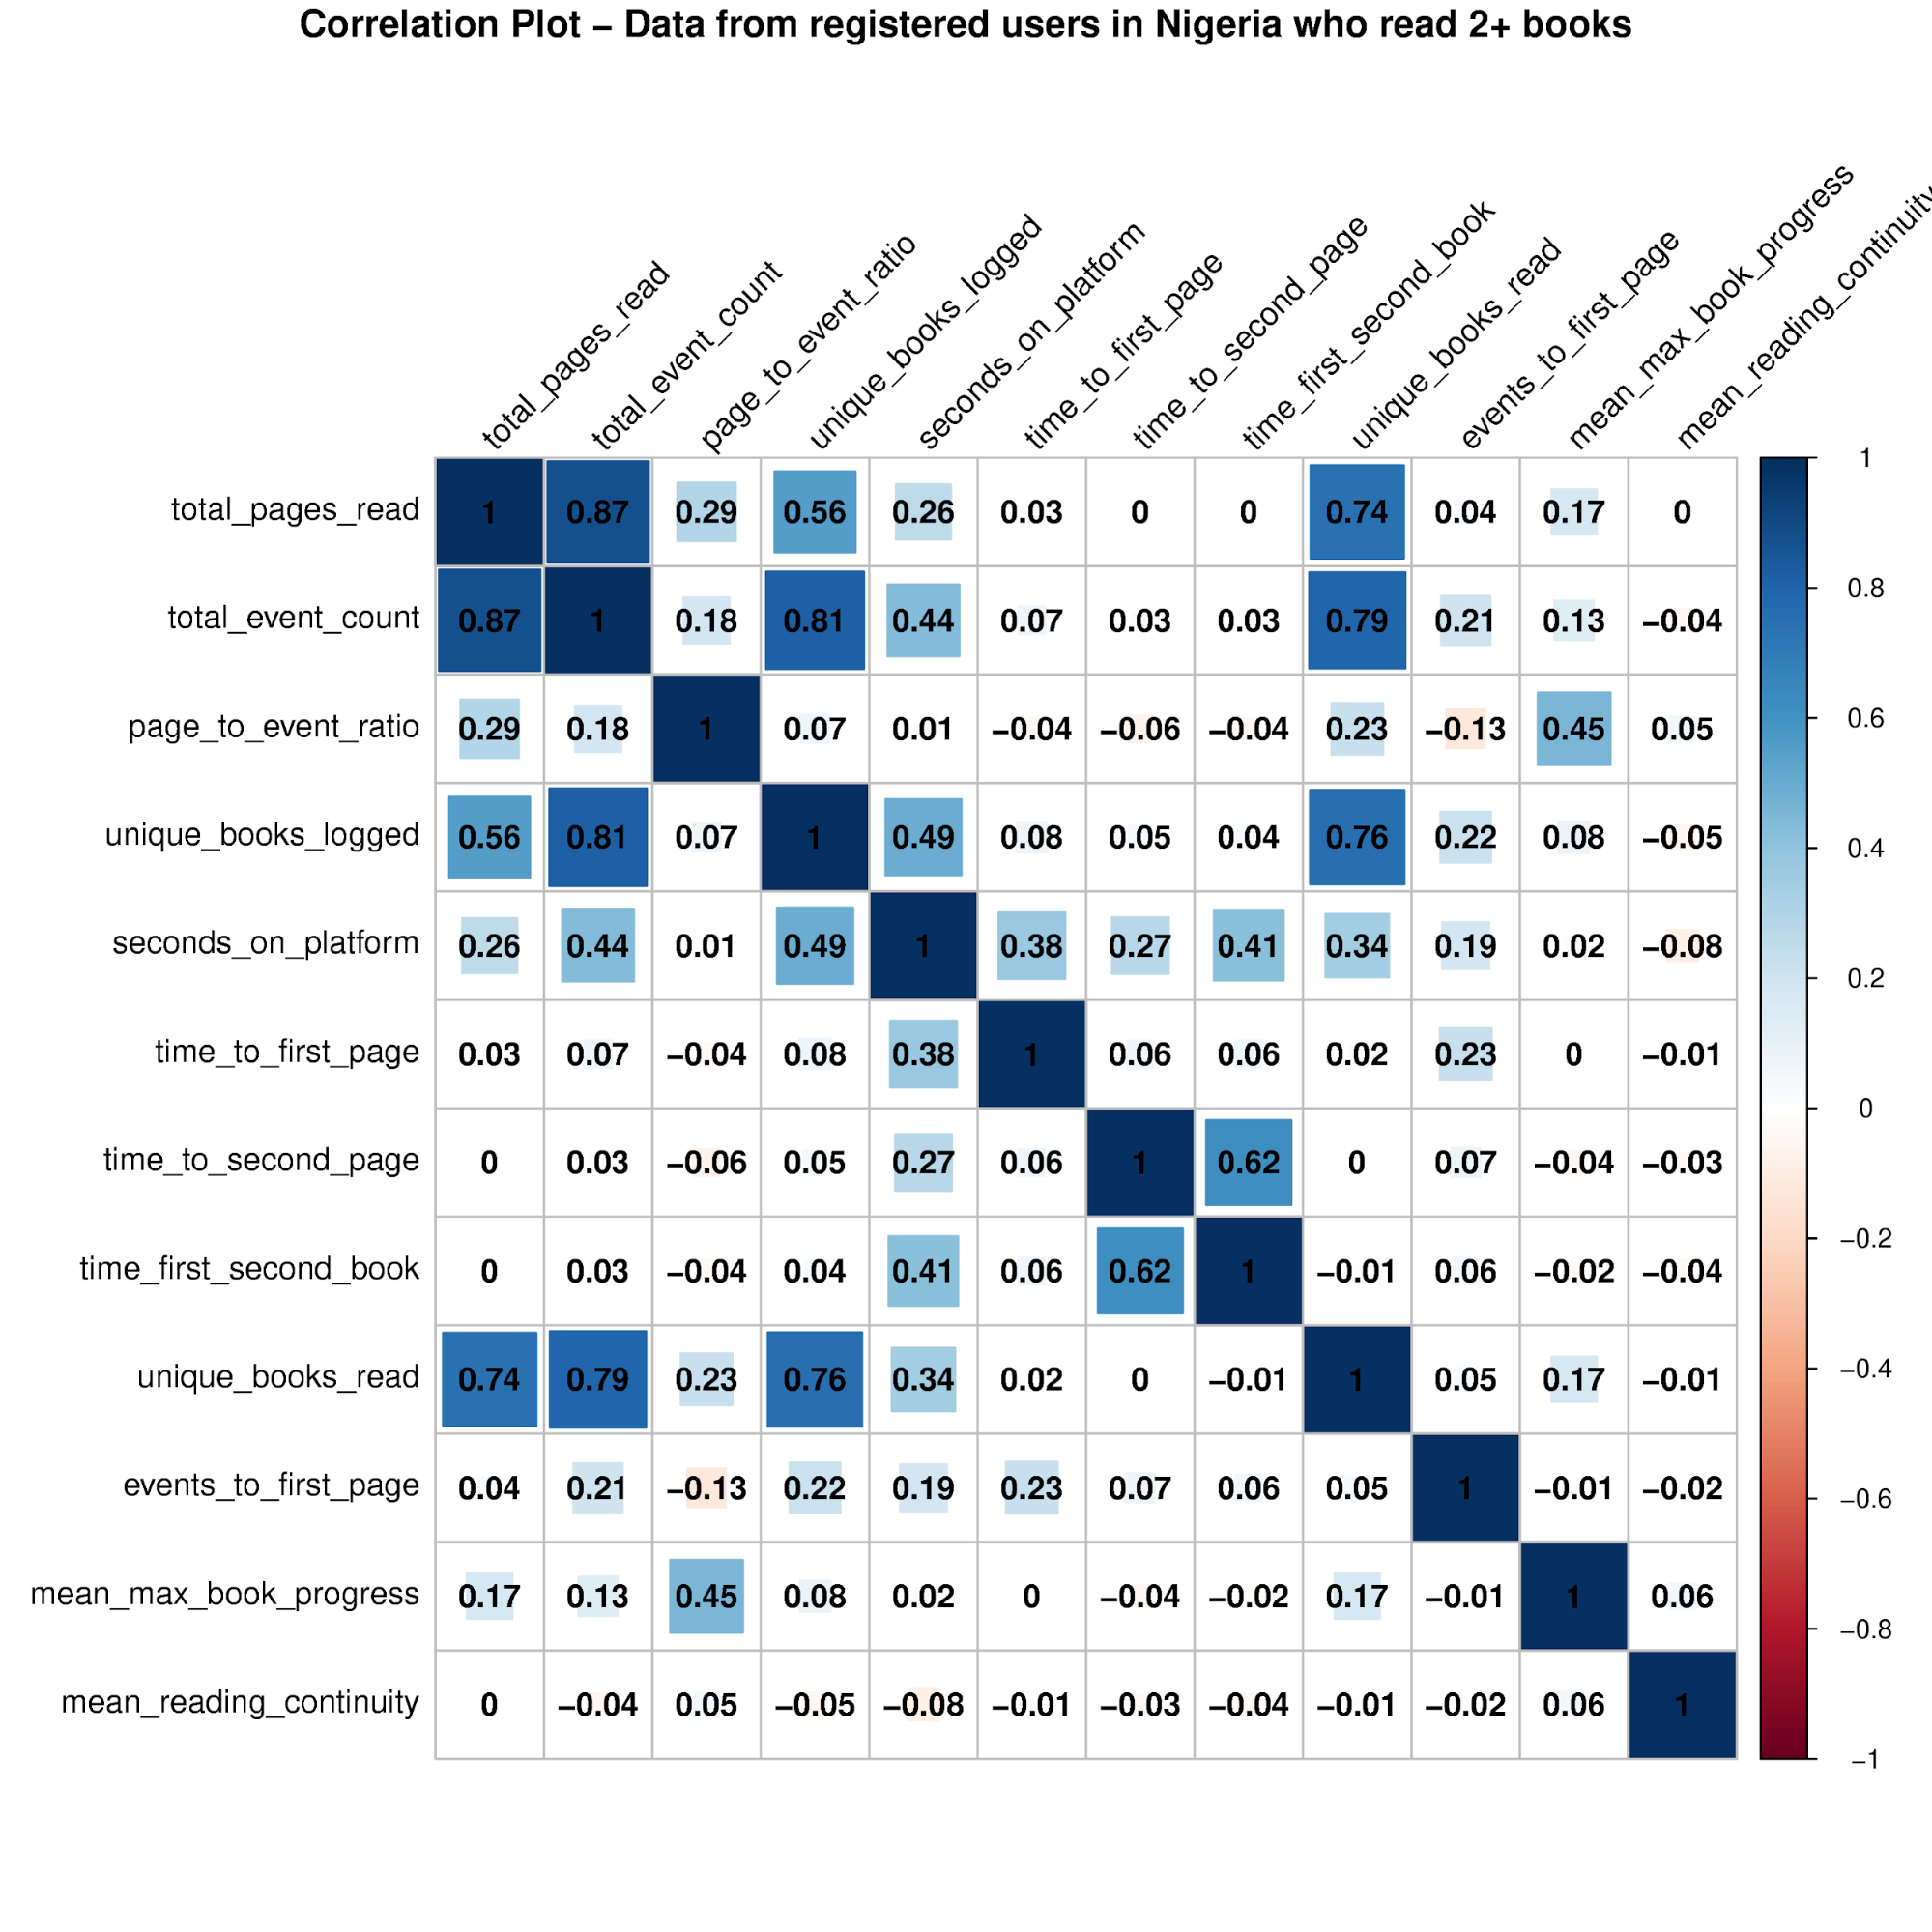
Figure 1. Data from registered users in Nigeria who read 2+ books.
The correlations between these indicators are shown in Figure 1. This graph is restricted to users who read pages from 2+ books, since the correlations without the indicators dependent on 2+ books read are very similar, and this gives the most complete picture of how all these indicators interact.
First off, there are a number of indicators that are highly correlated. However, I expect that most of these strong relationships are to be expected from how the indicators are defined. For example, total pages read is highly correlated (0.74) with the number of unique books read, but we would naturally expect users to read more books as they read more pages. Similarly, total pages read is highly correlated (0.87) with the total event count, but we would also expect that since to read more pages requires more log events.
There are some relationships that are moderately strong, and also of a more interesting nature. For example, the average maximum book progress is positively correlated (0.45) with the page to event ratio, meaning that users who read pages more densely compared with other actions on the app also leave books more completed.
Plotting the relationship between the book progress and book continuity variables (Figure 2) shows some interesting features that may be worth exploring more. This graph shows for each user their maximum book progress averaged over all books read, versus the average reading continuity for all books read. The colors of the dots differentiate between users who read in 5 or fewer books, 5-25 books, or more than 25 books.
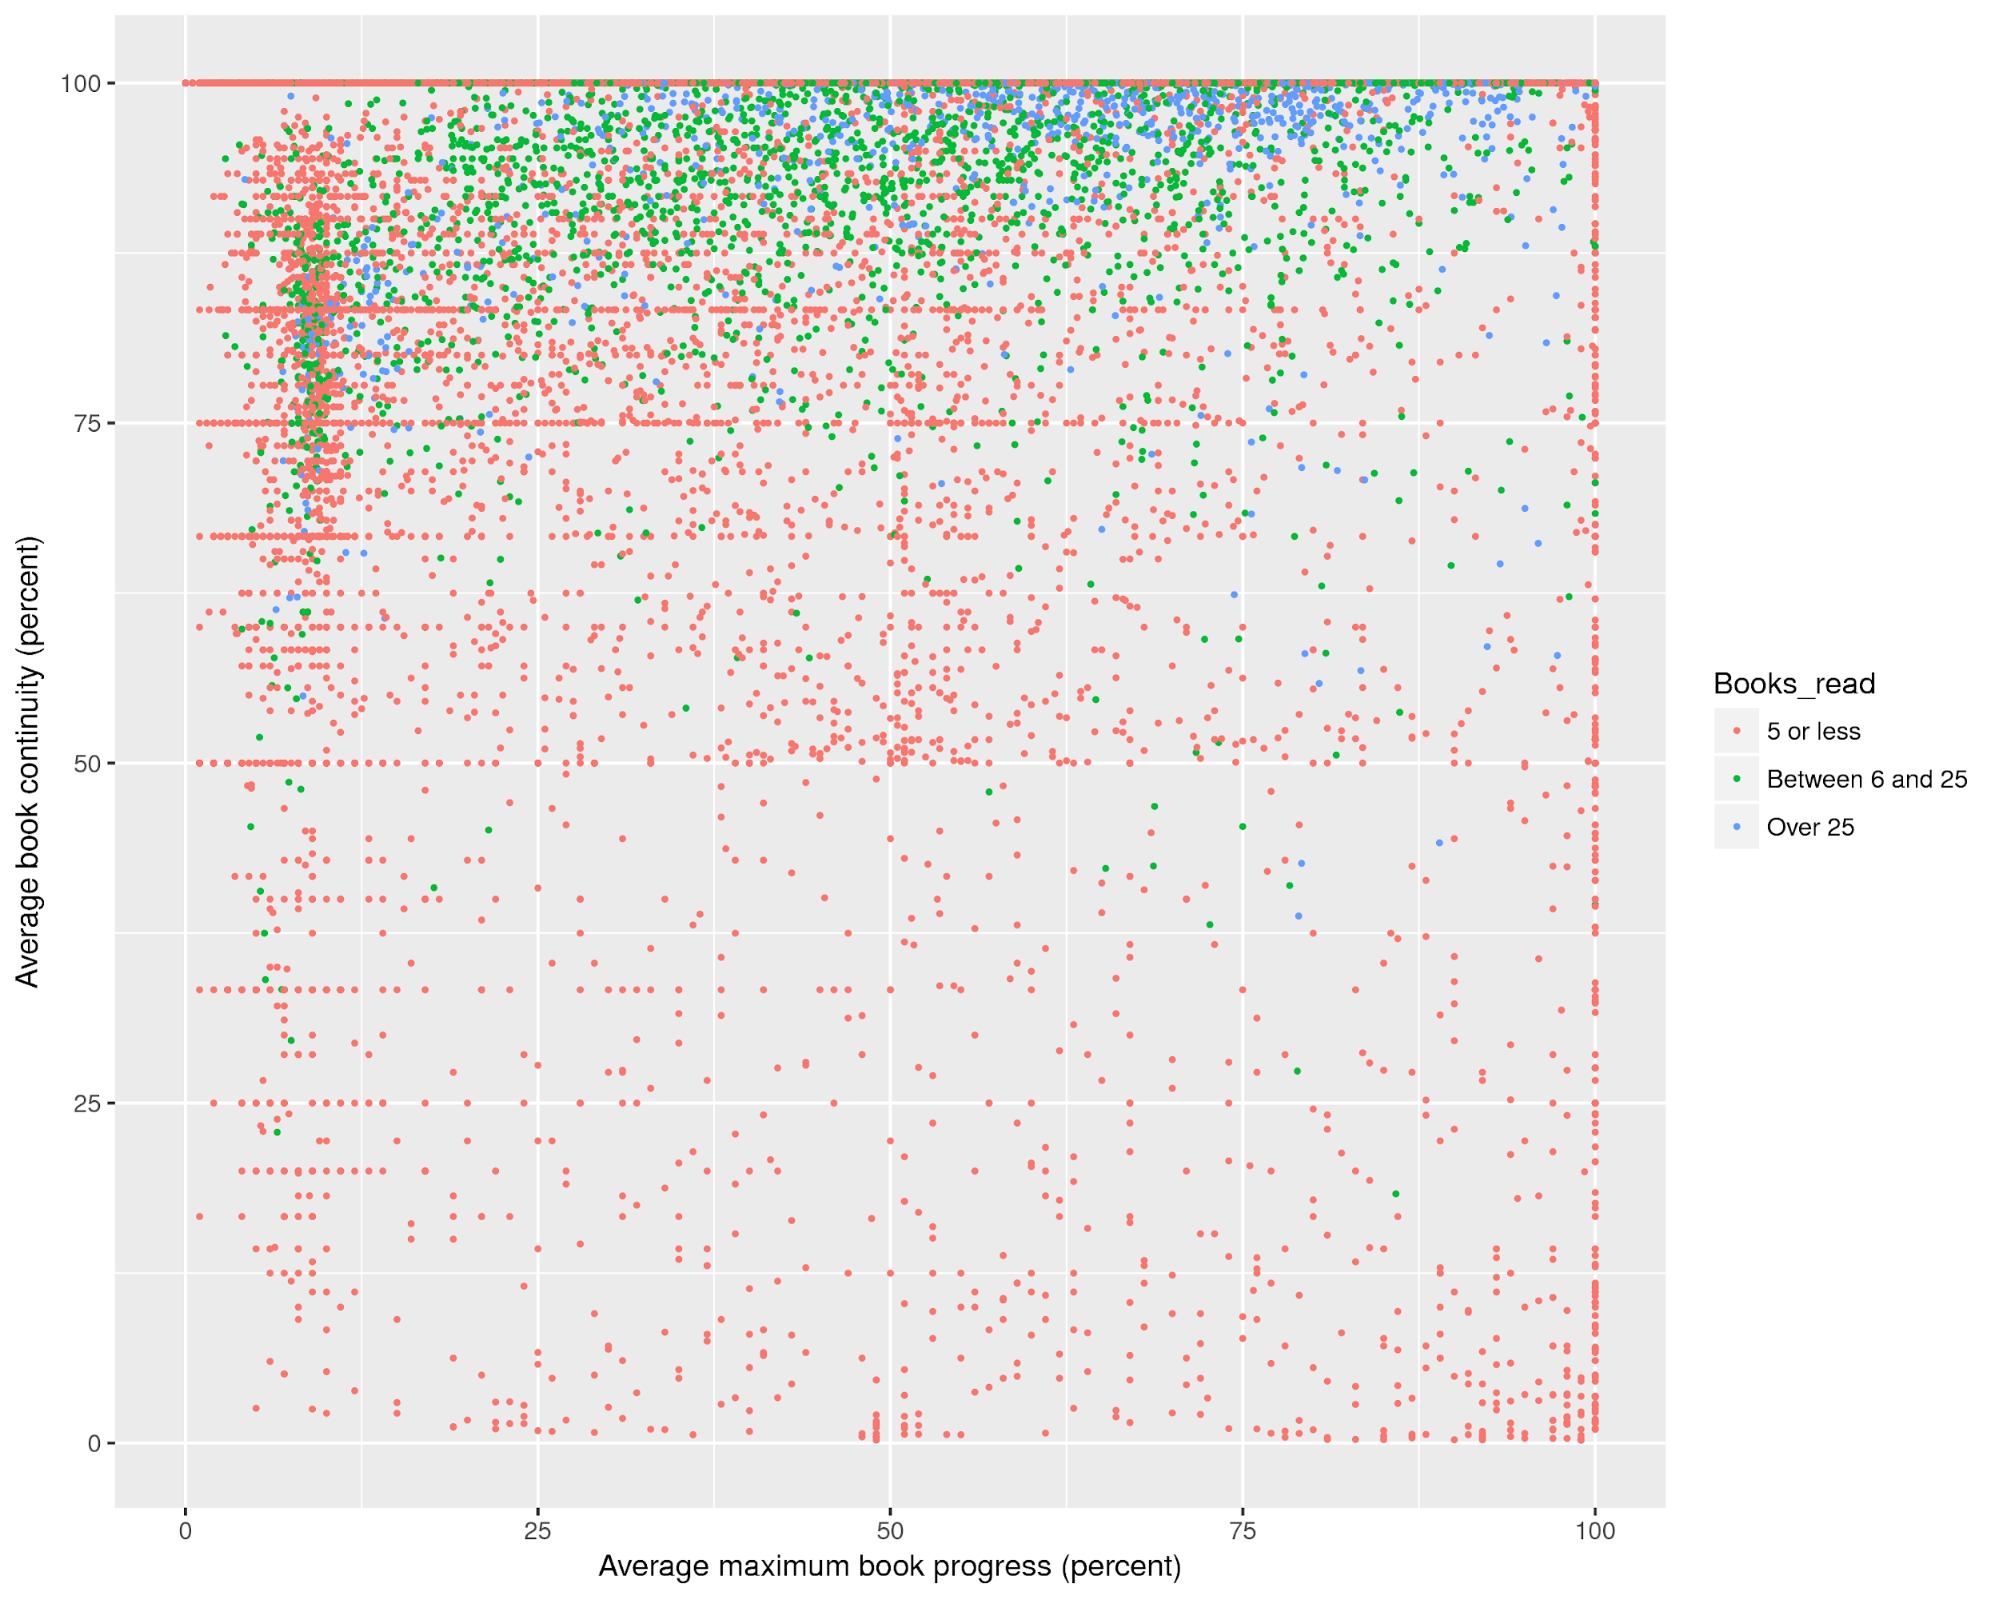
Figure 2. Relationship between book progress and book continuity variables.
There are a couple of interesting features to note. The first is the group of mostly orange dots in the upper left corner, showing users who did not make it very far into books but still read most of the pages to get there. With many orange dots, this group also did not read many books in general. The other interesting feature is the density of green and blue dots near the top of the graph, suggesting that users who read more books don’t skip many pages. The lack of green and blue dots on the very right-hand side also suggests that it could be mostly users who read fewer books that skip to the end.
The strong correlations between many of these indicators makes teasing out informative differences difficult. Combine this with the very skewed distribution of many of them (most users have low usage, some have a huge amount), and drawing conclusions from these correlations is a challenge. Obviously more reading pages is correlated with more log events, because you naturally create more log events when reading, but if these two scale together (so the density of reading pages vs other log events remains about the same) then that doesn’t really tell us why some users read more than others. Overall, my analysis here suggests that the really broad calculations like these correlations will struggle to effectively explain user behavior in an extensible or predictive way.
However, at the same time defining, computing, and studying these indicators is a great stepping stone to more analysis. We have to dig a little deeper to hopefully uncover driving factors for reading. One promising next step is to explore how users get to their first book: search, browse recommended titles, or peruse the catalog? This will have to wait, because it is a challenging question, since the log event that “led” to the book being read may not have come immediately prior to the page read event. This necessitates applying a much more complex function to each users log data to determine this, which will be extremely challenging to apply to the 58+ million unique users. For now, though, we will turn our attention to examining user journeys across different genres of books, which will be the subject of the third post in this series.