Introduction to Data Lifecycle - Collecting Data
3 hours
Download this module or visit our downloads page for more options
Student Objectives
- Understand basic concepts of data lifecycle - including the collection, analysis, and sharing of data for decision-making.
- Apply the data life cycle to a real life scenario at their own organization.
- Be able to identify different potential future sources of data.
- Understand data collection protocol.
- Raise awareness of free online data collection and data management sources.
- Recognize misleading data sources and visualizations.
- Understand the pitfalls of lying with data and how to avoid it.
Materials
- Projector
- Computer
- Blackboard/whiteboard (ideally)
- Paper
- Pencils
- Printout of images
- Activity packet 3.1
- Activity packet 3.2
- Student handbook
- Instructor Powerpoint slides
-
Review
15 minutesWelcome the participants back. Remind the participants of the structure for today: two, three-hour workshops with a break in between for lunch. Also use this time to go over any administrative tasks as necessary.
Then, review the following key concepts with the participants. Again, as before, try to have the participants provide their own definitions before you provide them.
- Data
- Data for decision-making
- Stakeholders
- Assessment
- Mission
- Vision
- Data producer
- Data consumer
Ask, what are the key steps to using data for decision-making? Remind the participants:
- Identify a problem or research question
- Assess data available to you and your data needs
- Identify stakeholders
- Plan for how data will be used, analyze, and shared
Pause to ask if anyone has questions so far.
-
Introduction to Key Concepts: Data Lifecycle
15 minutesWrite the word “lifecycle” on the board or project it on the screen. Ask the class what they think the word means. Where have they seen this word before? What kind of examples of lifecycles can they provide? If the class is quiet or slow to respond, feel free to provide some guiding questions, such as what is an example of a lifecycle within their own life? An animal’s life? A plant’s life?
Tell the class that much like living things, data has a lifecycle of its own.
Project this image on the screen, or pass it around to participants.
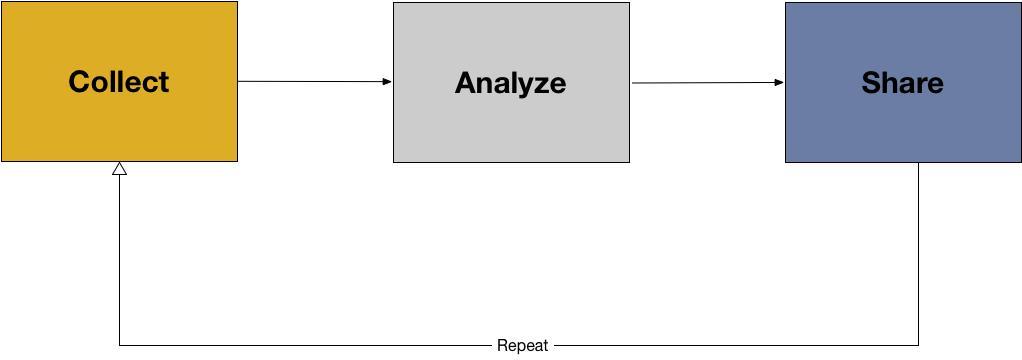
Then, tell the class that this image represents a data life cycle. There are three stages:
- Collecting data
- Analyzing data
- Sharing data
Remind the class that when using data for decision-making, it is often best to begin the data lifecycle with a question or problem that they are trying to solve. This helps to make their work more efficient and effective. There can be cases, however, when they have a dataset first and want to see what kinds of decisions they can make by using these data.
Then, move on to the following definitions. As before, solicit the class for their own definitions before providing them with the ones below.
- Data collection: data collection is the process of gathering information in a systematic way. Collected data are generally intended to answer questions and/or evaluate outcomes.
Remind the class that data can be collected from surveys, questionnaires, interviews, or observations.
- Analyzing data: data analysis is the process of inspecting, cleaning, transforming, and visualizing data with the goal of discovering its useful information, suggesting conclusions, and supporting decision-making. (Wikipedia)
Take time to explain to the participants that data analysis is made up of many stages:
- Inspecting the data
- Cleaning the data
- Transforming the data
- Visualizing the data
Introduce the above concepts, but make note that they will be explained in more detail in the next module. Then, provide the definition for the last part of the data lifecycle:
- Data sharing: data sharing is the process of making data that are used in problem solving, research, or evaluation available to others.
Underscore to the participants the importance of sharing data. Many funding agencies, institutions, and publication venues around the world have policies regarding data sharing because transparency and openness are considered to be key parts of research. In addition to the data themselves, metadata and documentation should also be shared if possible.
-
Providing Context
30 minutesProvide context by going through these steps in a country specific example and a generic example.
Below, two examples have been provided of applications of the data lifecycle. One is a generic example, and one is a country specific example for Myanmar. If implanting this curriculum outside of Myanmar, it would be helpful to provided participants with data lifecycle examples in their own countries.
Generic Example: Digital Green, India
The use of information and communications technology (ICT) in agricultural services is becoming increasingly common. These technologies—which include radio, SMS, television, video, and Internet services—have the potential to help smallholder farmers increase their incomes by making it easier for them to learn about and adopt new farming methods, grow higher-value crops, or connect with new markets.
Digital Green, an international non-profit organization based in India, uses locally-produced videos and in-person facilitation to share knowledge about improved agricultural and nutrition practices. The program aims to help rural communities across South Asia and Sub-Saharan Africa understand and adopt better agricultural and nutrition practices, and the ultimate goal of the program is to have a positive impact on individual well-being. Digital Green is currently working in nine states in India, and also in Afghanistan, Ethiopia, Ghana, Niger, Tanzania, Malawi, and Papua New Guinea. Since its start in 2008, Digital Green’s program has produced over 4,000 videos reaching more than 800,000 viewers across more than 9,000 villages.
Digital Green is in the process of measuring the program’s impact on farmer livelihoods, and health status using evaluations in both India and Ethiopia. In India, Digital Green is also measuring the program’s effect on improving nutrition-related behaviors. The organization has also invested in an activity monitoring system that reports data on program implementation and tracks the adoption of Digital Green-promoted practices from remote locations. One challenge in the activity monitoring system is its reliance on data from partner organizations, which varies in quality. Recognizing the issue, Digital Green has instituted a series of data quality checks and procedures to improve quality. The Goldilocks Initiative’s recommendations for Digital Green focus on its agricultural activities, and include refining and consolidating the program’s theory of change and conducting a systematic review of data quality. (Innovations for Poverty Action Lab, 2016)
Myanmar Specific Example: MIMU 3W
In 2008, after Cyclone Nargis, the Myanmar Information Management Unit (MIMU) launched their 3W project to track and share humanitarian and development activities undertaken by all agencies across Myanmar.
3W stands for “Who does What, Where.” By keeping an up-to-date database on which organizations (who) are conducting certain activities (what) in Myanmar (where), other organizations and donors can better target beneficiaries to ensure humanitarian and development needs are met.
The partnered agencies share their information on planned, ongoing, and recently completed activities every six months using standard sector definitions and MIMU compiles these data. They clean and digitize the data, creating quality baseline data sets on humanitarian and development efforts in Myanmar and on responding agencies in the country. They then make the data publically available for other agencies to use. The intended impact is that agencies and donors can use these data to determine which areas, sectors, and populations to target in their future projects. (http://themimu.info/3w-maps-and-reports)
After each example, take time for discussion with the participants regarding data life cycles. Some guiding discussion questions include: What was the problem the organization was trying to solve? How did the organization collect data? How did they plan to analyze data? How will they use data to make a decision? How can the organization share their data? How does the organization question their data quality? Can all the data be shared openly? What kinds of issues need to be considered if data are or are not shared?
-
Activity 3.1: Data Collection Telephone
25 minutesObjectives:
- Apply the data lifecycle to a classroom activity
- Understand each phase of the cycle and questions to consider throughout the cycle
- Think creatively and critically about how to apply the data lifecycle to different situations
Materials Needed:
- Paper
- Pencils
- Data management plan template (located in the Appendix of the Activity Download)
- Timer or stopwatch
Introduction: (Use the following information to introduce and explain the activity to the class)
This activity will help participants apply the data lifecycle by having them think through various stages of the lifecycle from unique, real world examples from other participants. Explain to the participants that this game builds upon a popular children’s game in the United States called “telephone”. In this game, a phrase is whispered from one individual to the next, and the individual is not allowed to ask for the phrase to be repeated. Then, the individual whispers this word to another individual, and so on and so forth until the phrase is passed on to all the individuals participating in the game.
If need be, feel free to play the game as an example to provide context for the students. Example phrases to use in the game could be anything, such as “dogs dig holes for big bones” or “beggars can’t be choosers”.
Keep in mind the phrase that you use should be short and simple in order to not make the game unnecessarily complicated. Start the chain yourself, and then have the participants pass the phrase along by whispering into each other’s ear one by one, until the phrase gets to the last participant. Have the last participant stand up and say the phrase. If you are lucky, the phrase has been kept intact throughout the chain. However, often the phrase will have been muddled and may turn into something completely different.
Introduce to the participants that the class is going to do a similar activity, but revolving around the data lifecycle. Break the class up into groups of 2-3. Pass out the data management plan template to each group. Once each group has one, explain that each team should begin by writing a question they want to answer with data in the provided space on the sheet. Then once everyone is finished, groups will pass their data management plan to a different group. Then, that group will have four minutes to think through one phase of the data lifecycle for the problem or question from the other team. Then, once time is up, the paper is passed to another team, until the problem has gone through the phases of collection, analysis, and sharing.
Once the phases are complete, return each group’s original data collection plan to the appropriate owners. Have the class look at the responses before leadings a discussion about what happened in the activity. Some guiding questions include: What was planned for data collection, analysis, and sharing? Is it different from what you would have done yourself? How has the telephone game enhanced your understanding of the importance of collaboration? What issues around data privacy and security should be considered if sharing data?
After activity, dismiss the class for a ten-minute break.
-
Understanding Data Collection Methods
10 minutesTransition with the participants by saying that now that they have a deeper understanding of data collection as a whole, the next part of the module will focus on data collection processes, protocols, and concepts.
Ask the class if they know what “primary” and “secondary” data are. Solicit answers from the class. Then, provide them with the following simplified definitions:
- Primary data: information collected by you or your team.
- Secondary data: information that is collected by a third party.
Take time to discuss with the class the benefits and drawbacks of each kind of data. Primary data are valuable in that you have control over the collection of the data and direct knowledge of how the data have been managed. But they are more costly, time-consuming, and certain expertise is needed for data collection design.
Take the time to walk the class through the different forms of primary research.
Then, state that secondary data are also valuable because they can improve your insights, help plan new data collection, or answer existing questions without having to spend time and money collecting data. Walk the class through different sources of secondary data, such as:
- Journals
- Books
- Newspapers
- Records
- Previous reports and analyses
Ask the class for examples of primary and secondary data at their own organizations. If they collected primary data, what were the benefits of that? What were the disadvantages? What about the benefits and disadvantages of using secondary data for a project?
Underscore to the class that in many cases it is valuable to use a combination of both secondary and primary resources in making a decision with data.
-
Introduction to Key Concepts
15 minutesA key part of any data collection plan are data collection protocols. Ask the class what a protocol is. Once they have provided their own definitions, ask the class what they think a data collection protocol might be. Then, provide the following definitions:
- Protocols are systematic plans for how a set of operations are to be carried out
- Data protocols are systematic plan for how data are to be collected, stored, and described
Data collection protocols can help save time and resources by specifying the format the data should be collected in, the types of data you want to generate, the instruments you will use to generate and collect data, how the data should be stored, and how it should be shared.
Introduce the concept of “metadata” to the participants. Solicit the participants for their own definition of metadata, then provide the following
- Metadata: information that describes, explains, or gives context for other data. They are provided to make it easier to interpret, use, and manage data.
Metadata are important because they are used to add context to data. Metadata are the key for primary data to be used as secondary data. Two examples of metadata types are:
- Descriptive metadata (Such as who created the data, what was the data created for, where was the data collected, and when the data was collected)
- Administrative metadata (Why these data were collected)
Ask the group for examples of metadata.
-
Key Considerations in Designing a Data Collection Plan
15 minutesThere are key questions that should be considered when designing any data management plan. Walk through the below questions with the class:
What questions are trying to be answered?
The first step before collecting data is to clearly understand the problem. Write down a set of questions and potential ways they can be answered with new or existing data.
What do you need to know?
Often when we list the kinds of data we want it can become a wishlist of things that are all “interesting” but may not all be necessary. Make sure everything in your list of “need-to-know” data are necessary for answering the questions or problem you stated. Go back and forth between the data and problems to make sure both match. You may need to remove some data from your wish list if they do not support the problem statements. You may also need to revise your problem statements if the data you list do not support what is there but you feel those data are vital.
When to collect new data (primary), and when to use existing data (secondary)?
This can be answered by exploring existing data sources, writing down explicit questions to be asked and trying to answer those with existing data sources, etc.
What instruments will you need to create?
Collecting new primary data requires significant time developing new instruments, making sure the questions are phrased accurately to get the data you need, and testing them before administering them.
Who will be involved in data collection, and for how long?
Plan to have people involved that can contribute data collection and analysis stages.
What documentation will be needed to use the data again?
This should tell the history of the data. Who created it? When was it created? Why was it created? What information does it include?
Project the steps of the data collection plan process on the screen or pass it around to the participants. State that this can help provide a helpful guide in the future when designing data collection protocols. Walk through the steps with the participants, taking time for discussion. If possible, have a student volunteer a problem they would like to see solved with data from the “telephone” activity. Then, walk through the steps with the class. Pause and answer any questions.
-
Providing Future Resources
20 minutesThe following section of this module provides participants with sample resources surrounding data management and collection that they can return to in the future. If using a projector, take time to go to each website and click around, providing commentary with participants about the website’s purpose and how they can use the website in the future. If not, provide screenshots of each source that can be passed around to the participants as the instructor describes each data resource.
Sample resources:
- Data Management Plan tool: https://dmponline.dcc.ac.uk/
- Following best practices in choosing a sample (size, diversity, relevant population, etc.) https://resolutionresearch.com/page/results-calculate/
- What are databases? How to design one? www.dartmouth.edu/~bknauff/dwebd/2004-02/DB-intro.pdf
- Creating a Google Form (see activity 3.2)
-
Activity 3.2: Data Collection with Google Forms
30 minutesObjectives:
- Create a survey using Google Forms
- Understand how to design a survey, the types of questions that can be asked, and how to view responses
- View response in Google Sheets, and use these responses for your own analysis
Materials Needed:
- Shared Computer
- Paper
- Pencils
- Google Account
Introduction: (Use the following information to introduce and explain the activity to the class)
Google Forms are free and openly accessible digital tools that can be used to design a survey. For our benefit, many of these tools work together – so we can use Forms to collect data, and we can use Sheets to view aggregated data.
In this example, we are going to design a simple survey for the sake of collecting data about people’s experience attending a movie. We want to understand what is typical of their experience.
Surveys are a valuable instrument for collecting data when doing evaluation, gathering information about an unknown subject, or generally understanding users behaviors. Some additional features that make for a good survey are as follows:
- The population is known, and can be separated (differentiated) in some meaningful way, such as by
- Age
- Gender
- Income level
- Education level
- You have a small set of questions that you want each participant to supply
- The questions you want answered are simple, and have straightforward answers
- The responses might vary by the type of participant
Survey questions can take a variety of forms – the most common types of questions that can be asked are:
- Multiple choice - participants choose from a set of examples
- When asking many multiple choice, or check-box questions, you can also use a “grid” format to ask many questions in a row. We will look at an example of this in our first exercise.
- Rank order - participants are asked to rank a set of options
- Likert scale – a participant is able to offer a judgement based on a numerical value (e.g. 1 being the best, and 5 being the worst)
- Open ended or Short answers – a participant is given the opportunity to, in their own words, respond with an explanation.
To create a new google form
- Log into your Google Drive account
- Go to https://docs.google.com/forms
- We can either create a new form, or select an existing template
For the first exercise, let’s select the “Exit Ticket” template
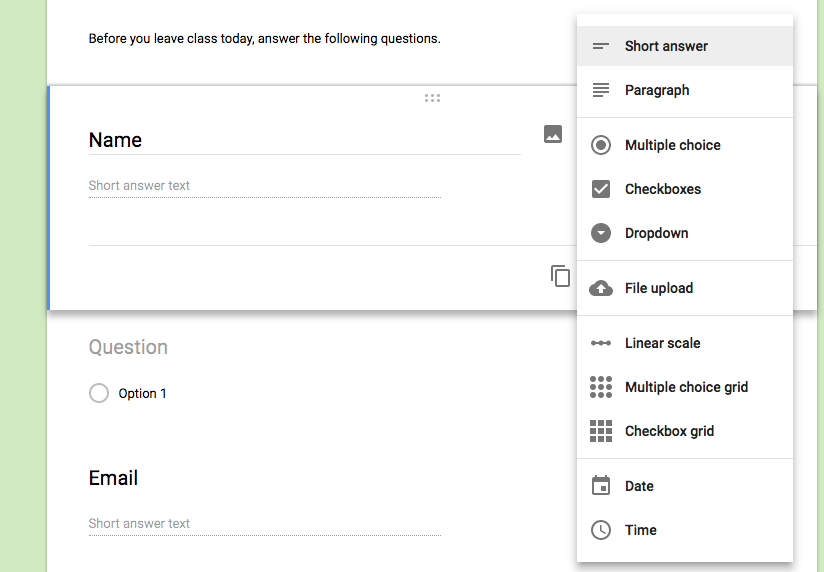
- Here we see an example of a form that allows participants to leave Short Answer responses about their experience in a class.
- Notice that in designing the form you can click on an individual question
- This gives you the option to change the type of question that is being asked, edit the text of the question.
- You can also select whether the question is “Required” meaning it has to be answered by each participant, delete, or duplicate the question.
- To move questions around in order, simply drag the 6 dots at the top of the question
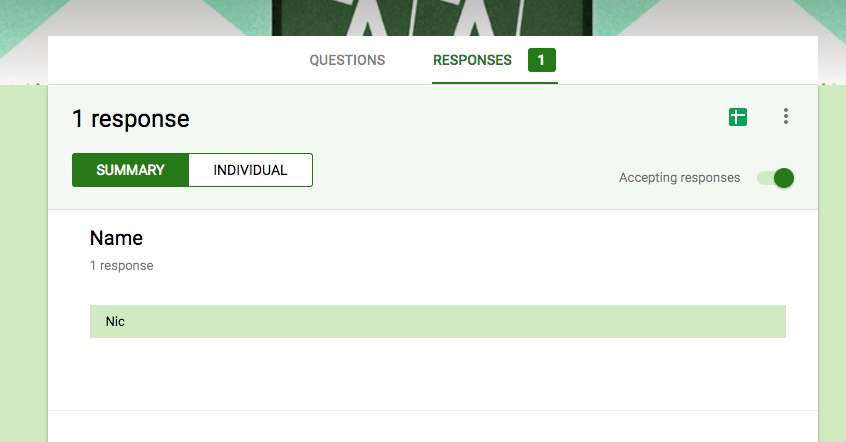
- After we have finished designing our form, we can also see what the responses will look like by clicking the ‘RESPONSES’ tab.
- The responses can be viewed by a Summary of all responses, or by each individual response
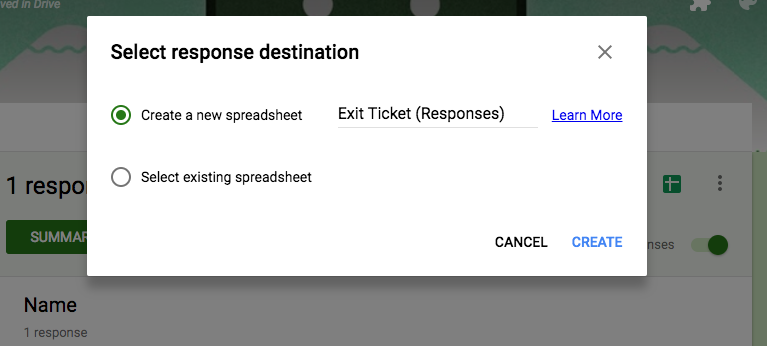
- It will be hard to use this information within the Form itself. To create a spreadsheet of all answers we can click the green button with a cross (the spreadsheet button). This will give us the option to create a google Sheets form to view our answers. Click the Sheets button and create a new sheet with the responses.
- The Sheet that opens has each question as a Column, and each row as a response to our questions. So, we can now view (in aggregate) all responses to our questions.


-
Lying with Data
25 minutesWe have noted before and want to again make the strong point that the same data can easily be manipulated and used to tell different, opposing, or inaccurate stories.
This can be intentional or unintentional. Not all bad or misleading storytelling is done with ill-intent.
Using data to mislead can be particularly challenging when there are powers in our work that may want to see certain things from data and directly or indirectly pressure us to find ways to say them.
It is important to always be thoughtful about how you and your peers are using data and be careful of political and other pressures that may lead to inappropriate use of data.
Find ways to respectfully talk with your colleagues and even supervisors if you feel data are being used incorrectly or inappropriately.
This training will not go into the many ways data can be used poorly. That is an entire course to itself. In fact, many universities now offer courses just on how you can spot data that are used to spread misleading information. However, here are a few of the many things to be careful of. Keep your data radar always active!
- Correlation vs causation
- A correlation describes a relationship between two or more variables. For example, both variables may increase or decrease at a similar rate, or one may decrease while the other increases. It does not, however, mean that one variable impacts the other or “causes” the other to change.
- If there is time, use the following website to show how correlations cannot be used to say one thing causes another. The examples show how real data trends could be spuriously used to show causation. More cheese consumption does not lead to more PhDs in Engineering or more people dying from being tangled in their bedsheets. These are very obviously not true. But it is harder to detect with other your data that are of similar subject matter.
- Causation shows that the change in one variable is the result of a change in the other. In other words, a change in one causes a change in the other.
- Examples both show how real data trends could be used to show causation. More cheese consumption does not lead to more PhDs in Engineering or more people dying from being tangled in their bedsheets. These are very obviously not true. But it is harder to detect with other data that are of similar subject matter.
- Misleading visualizations
- There are many ways visualizations can be misleading. Always be skeptical of the visualizations you and others create, even if published in reputable journals, papers, magazines, or other sources. The slides display a few examples.
- In the examples, the first graph doesn’t include 0. It gives the impression that German workers spend much more time working than workers in other countries. Once 0 is added, this doesn’t seem the case, does it? The differences are much less dramatic.
- Using bad data
- Sometimes bad data are used to tell stories without clearly indicating the data should not be fully trusted. Know the limitations of your data.
- Selective storytelling
- One can leave out pieces of a dataset that do not fit the “story” they want to tell with the data. You may not know if others do it, but you certainly can know if you do. Always stay honest in your analyses and be open to other stories that arise in the data, even if they don’t support what you want to tell.
- In this picture, FOX News did an analysis of unemployment rates under President Obama from 2009-2012, with the conclusion that Obama’s policies have led to a near doubling of unemployment. However, the methods they used to calculate the 2009 figure were different than the ones for the 2012 figure. The actual comparable figures should have shown a change from 14.2% to 14.7%. We should not assume the intent of using incorrect data was to lie, but the incorrect comparison did support a narrative the show was trying to tell and were clearly misleading.
- Key takeaways
- Summarize as seems most relevant to the group. Add expansion or other takeaways as needed
- With regards to the FOX News slide, note that FOX did apologize by saying "We mixed up the numbers on Wednesday, so we wanted to clear things up.” However, they left it at that and didn’t explain how they mixed up the numbers or what the correct numbers were. Humility is very important and we should be prepared to admit our biases and mistakes, and correct any story we may get wrong.
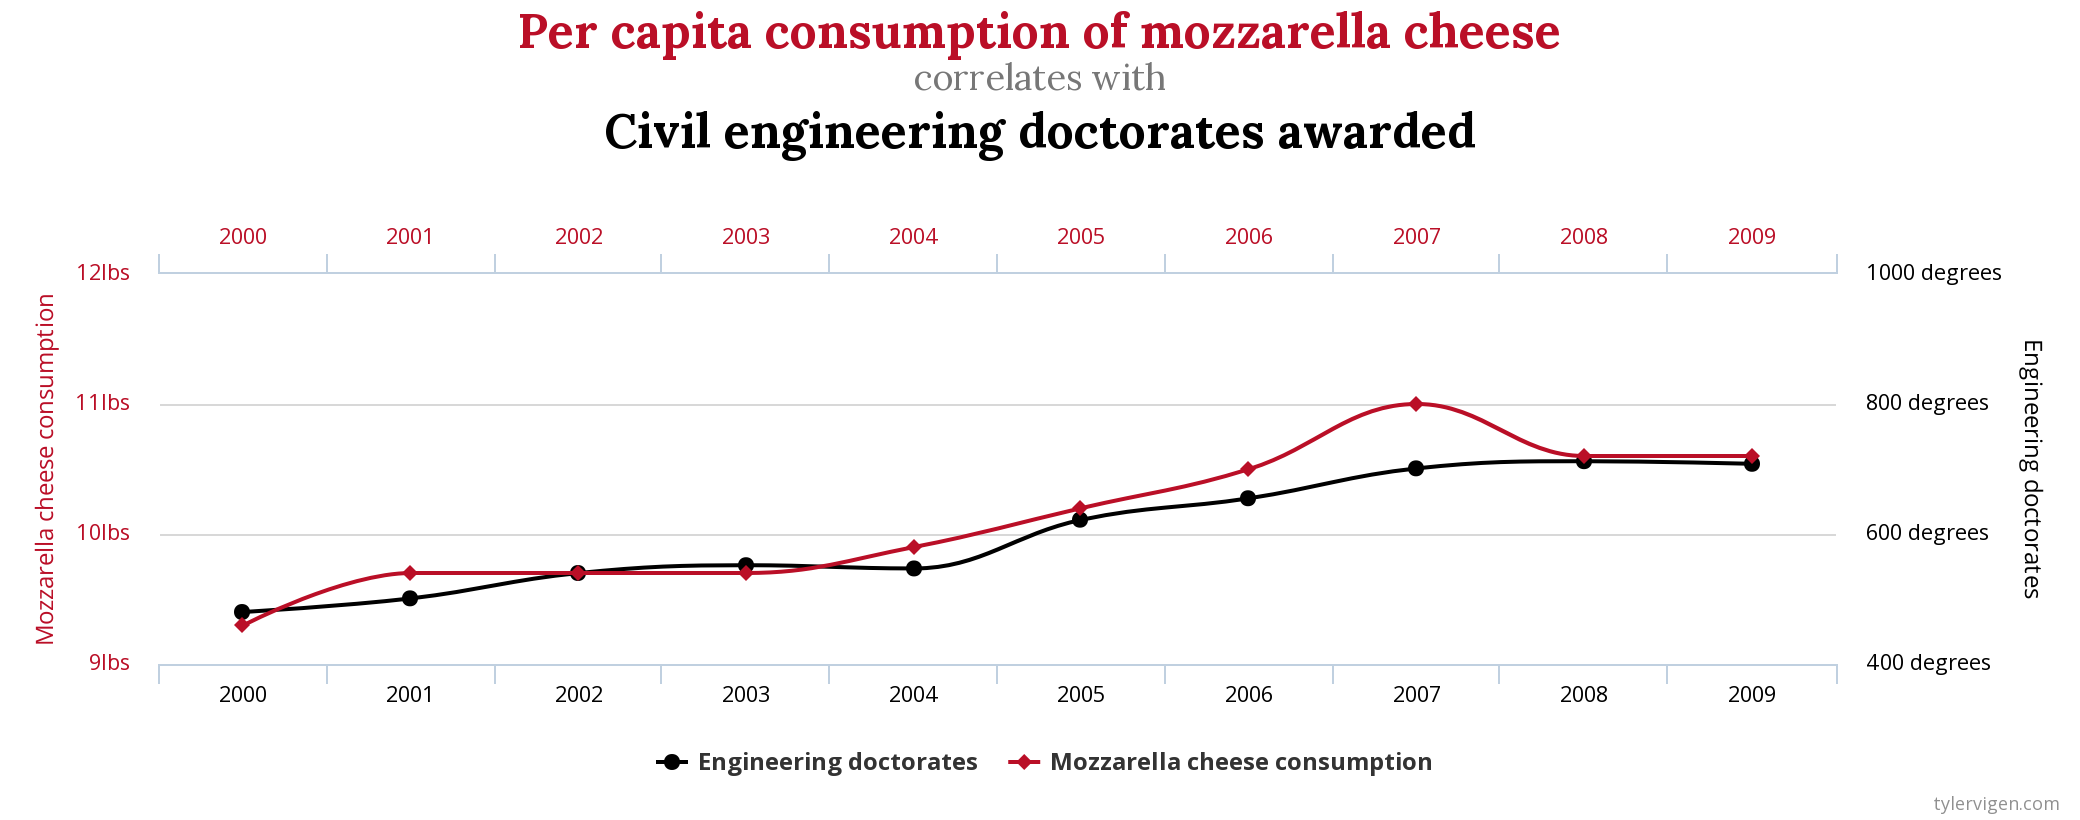
Source: http://www.tylervigen.com/spurious-correlations 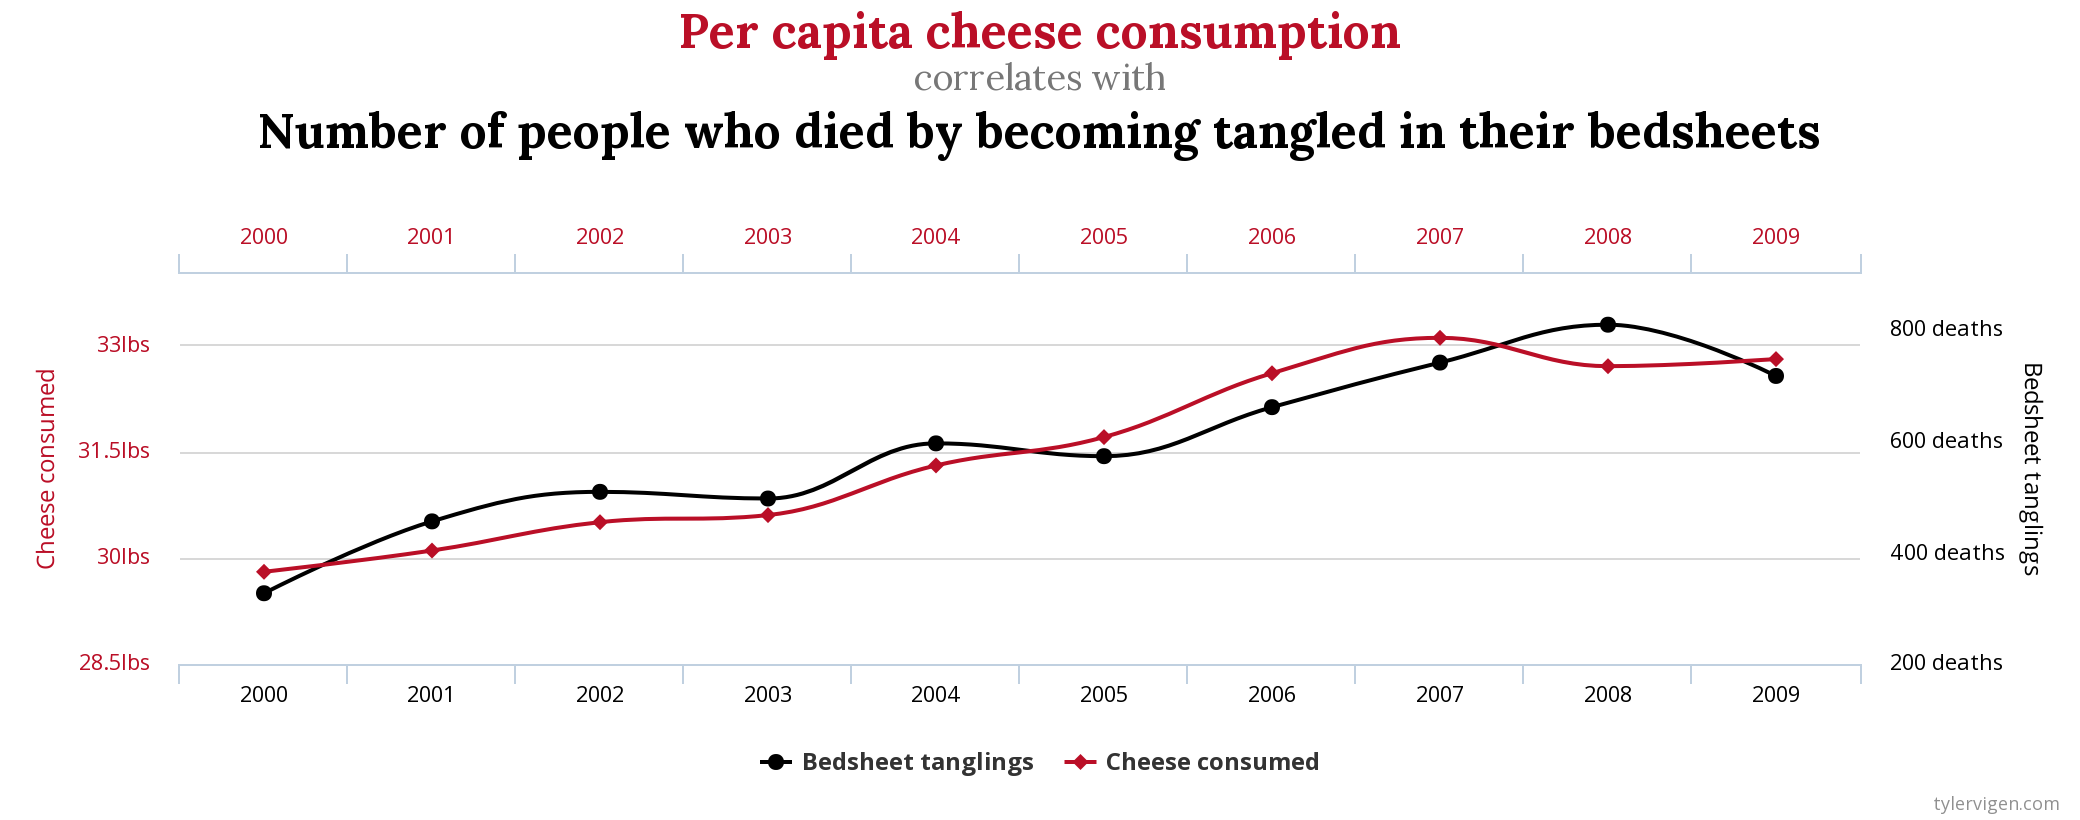
Source: http://www.tylervigen.com/spurious-correlations 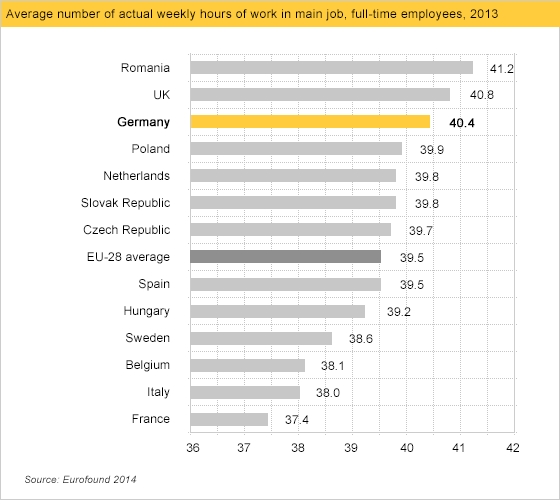
Source: Calling Bullshit 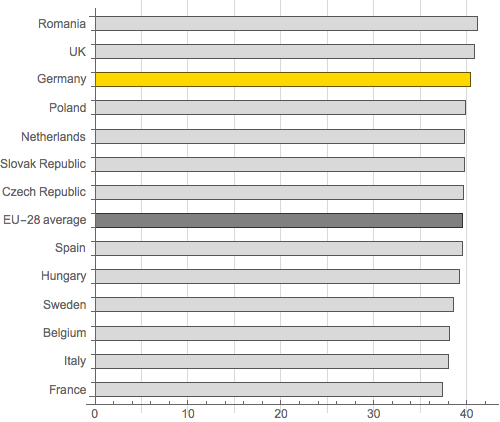
Source: Calling Bullshit 
Source: MSNBC The Rachel Maddow Show -
Debrief
5 minutesTake time to answer any questions the participants may have. Then, announce to the participants that the next module will focus on analysis and data sharing. Then, dismiss the participants for lunch.