Posted June 11, 2018
By Lucas Koepke
The immensely rich data that are available from user logs on the Worldreader app offer an exciting opportunity to explore how users interact with the app and the content, but at the same time presents numerous challenges to understanding this behavior and how it can be used to improve global reading trends. This post is the first of three that offer insights into our analysis of user behavior on the Worldreader app. In this post we’ll summarize some basic usage data for both registered and unregistered users. The second and third posts will respectively examine “user journeys”, the sequences of events recorded as each user interacts with the app (from browsing the library to reading book pages to searching for more content), and the popularity of different genres.
Across these three analysis topics, the overarching questions we wish to explore about user behavior are 1) how does user behavior differ by geography and phone type, 2) are there factors that positively or negatively influence reading, 3) are there events that typically occur before a user vanishes from the data, and 4) can we predict future behavior based on known data?
Due to the granularity of the data, all of these research questions require at least one, if not several, intermediate stages spent computing features from the log data and condensing the individual log events down to something that can actually answer a research question. These computationally challenging steps must take place before I begin the analysis to answer the research questions. Although I particularly enjoy these computational challenges, and the coding required to efficiently work with big data, I was also eager to turn this data into results that could be shared.
This entire process has been and continues to be very iterative. Not only do initial analyses suggest new ways of exploring the data but also new research questions emerge. Additionally, the data is being cleaned and updated, opening up new possibilities for analysis. For example, as data for how users interact with book content is improved, it may be possible to explore reading speed as another potential metric to compute. For now though, this post is laying the groundwork and documenting the process we used to build up our analysis of user behavior, culminating in machine learning models that we began to explore at the end of the project.
We start the analysis by first looking at some basic summary statistics about usage over the whole dataset (in this case: June 2016 to March 19, 2018). At this point, there are three primary variables used to slice these user summaries: 1) country, 2) registered vs unregistered (rough, based on user_id field populated or not), and 3) if Opera Mini was used as a browser or not. The only cleaning of the data was to remove duplicate page read events, which occur for smarter phones where a user swipes through pages and where that information is transmitted back to the server, and to remove rows without either a user_id or a client_id (typical of big data I have worked on before, issues like this tend to crop up in a few rows of data with no clear explanation, and are simply removed due to the very tiny proportion of data affected).
There are four indicators we will look at first: the number of unique ID values1 present in the data, the average number of book titles each ID accessed, the average number of log events recorded for each ID, and finally the average number of days between the first and last log event for each ID. There are two cross-cutting variables as well: user type (registered vs unregistered), and if Opera Mini was used or not.
For this time period, we observed that about 2.3% of the unique IDs come from registered users, and with the majority of both registered (85%) and unregistered (65%) users using Opera Mini (calculated by searching for “Opera Mini” in the browser string, further analysis below). On average, registered users on Opera Mini are on the platform for 8 days, and 7.9 days for other browser types. Unregistered Opera Mini users are also on the platform an average of 7.4 days, compared with just 2.4 days for unregistered other browser types.
Registered users are also much more active in terms of the total number of log events recorded (80.5 for Opera Mini, 389.1 for other) compared with unregistered users (9.1 for opera mini, 6.2 for other). The number of unique books accessed (not necessarily read, could have just read the front matter or other) also varied. Registered users on average accessed more books (2.4 for Opera Mini, 3.3 for other) than unregistered users (0.9 for opera mini, 0.5 for other).
| Id_type | opera_mini | num_ids | books_accessed | avg_events | days_active |
|---|---|---|---|---|---|
| Client_id | False | 19,921,066 | 0.457159 | 6.15823 | 2.431875 |
| Client_id | True | 36,891,632 | 0.948358 | 9.08520 | 7.381910 |
| User_id | False | 158,915 | 3.333670 | 389.10200 | 7.882801 |
| User_id | True | 1,183,492 | 2.395260 | 80.45680 | 8.047072 |
The difference in usage between registered and unregistered users is further illustrated in the following graph (showing data for the top 10 countries only). This part of the analysis of the full log data actually came later in the analysis timeline, after I stepped back for a moment from defining a long list of potential indicators to compute, and followed Bree’s suggestion that the most basic metric for any user was simply the counts of the various types of events they logged in the data. This graph shows the log event counts sliced by id type and opera mini, with only the top 30 event types shown.
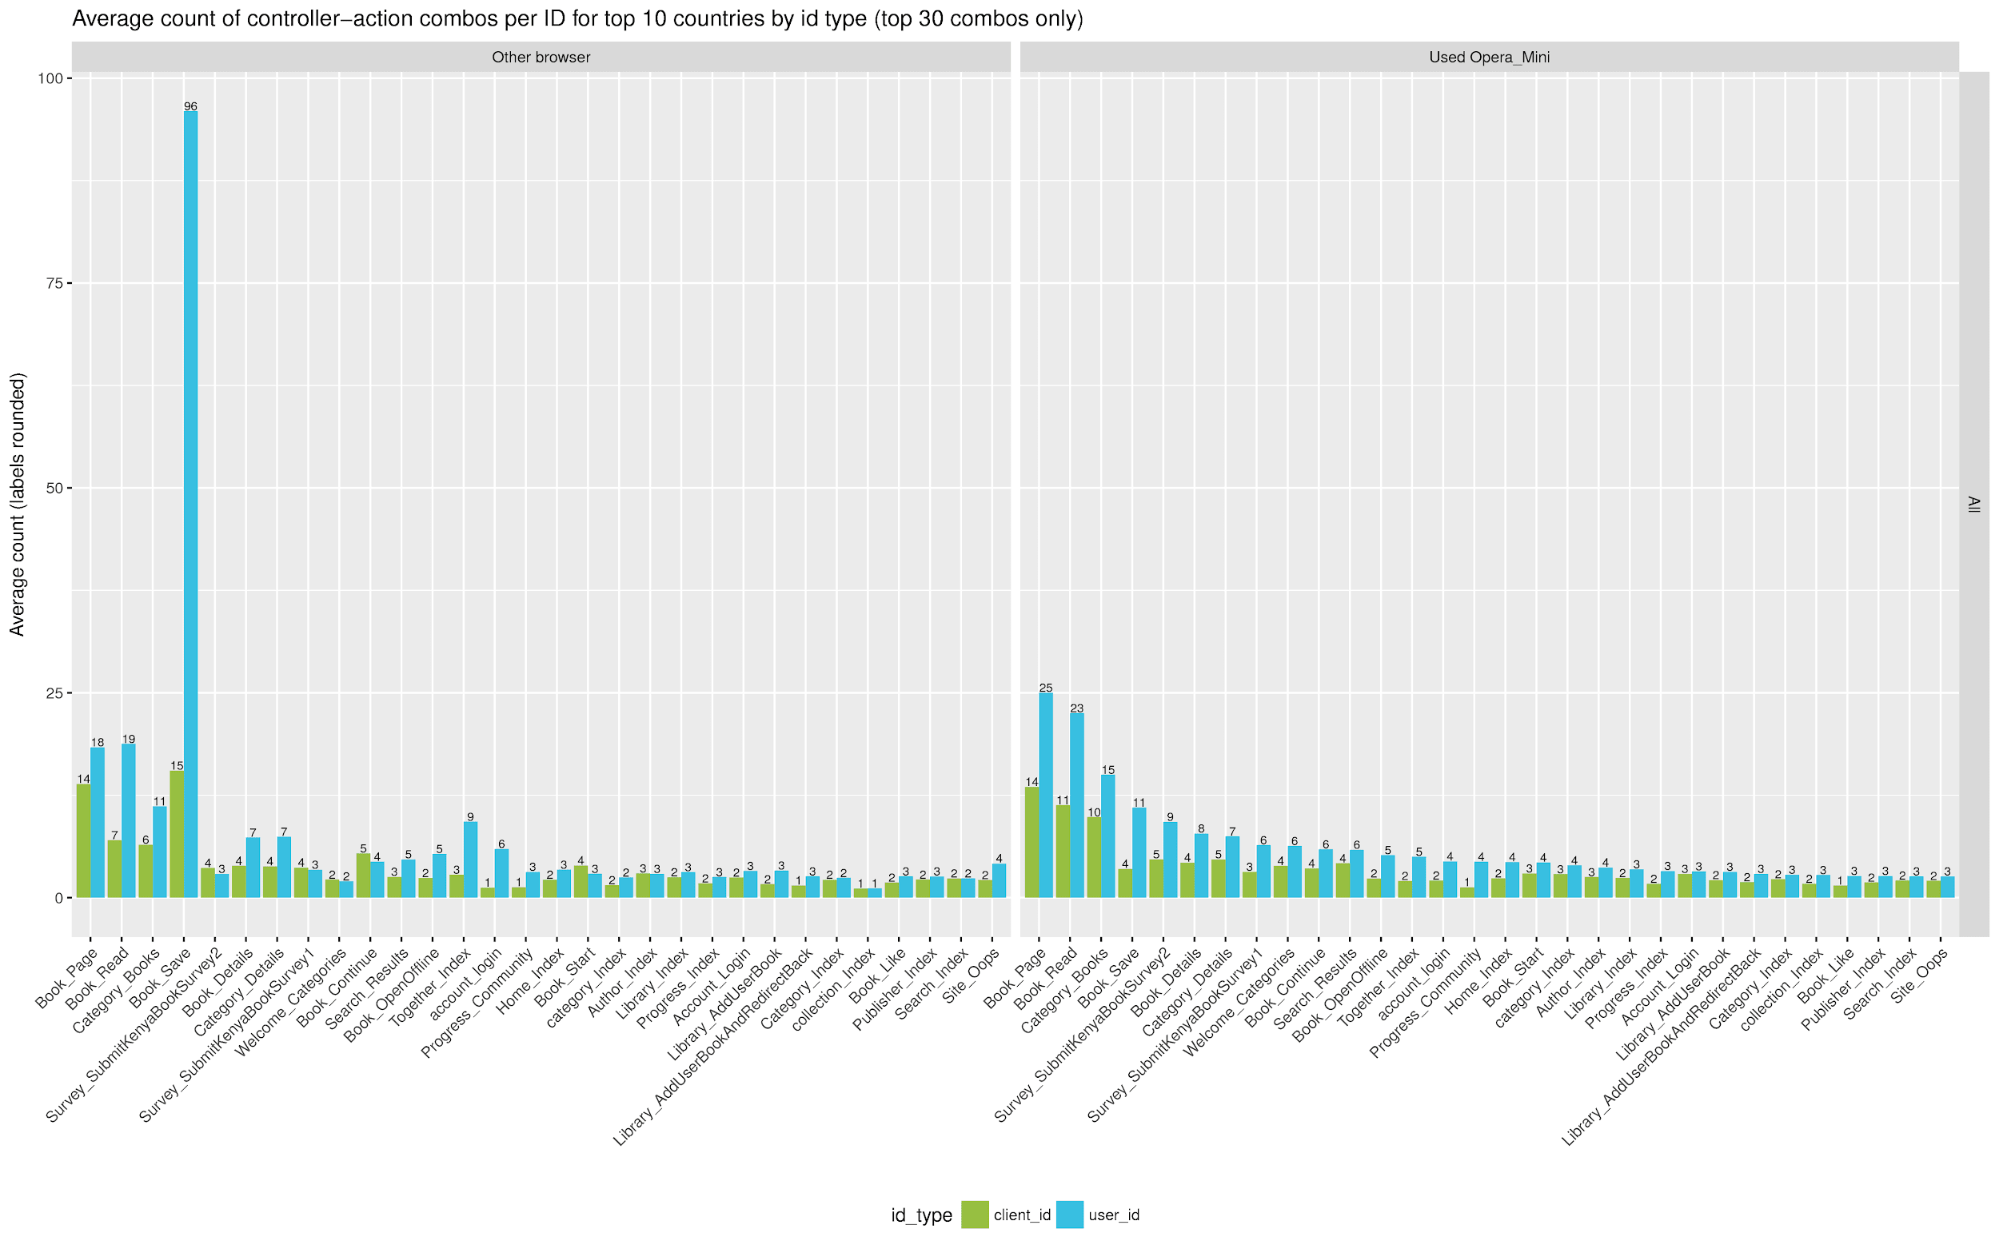
Figure 1.
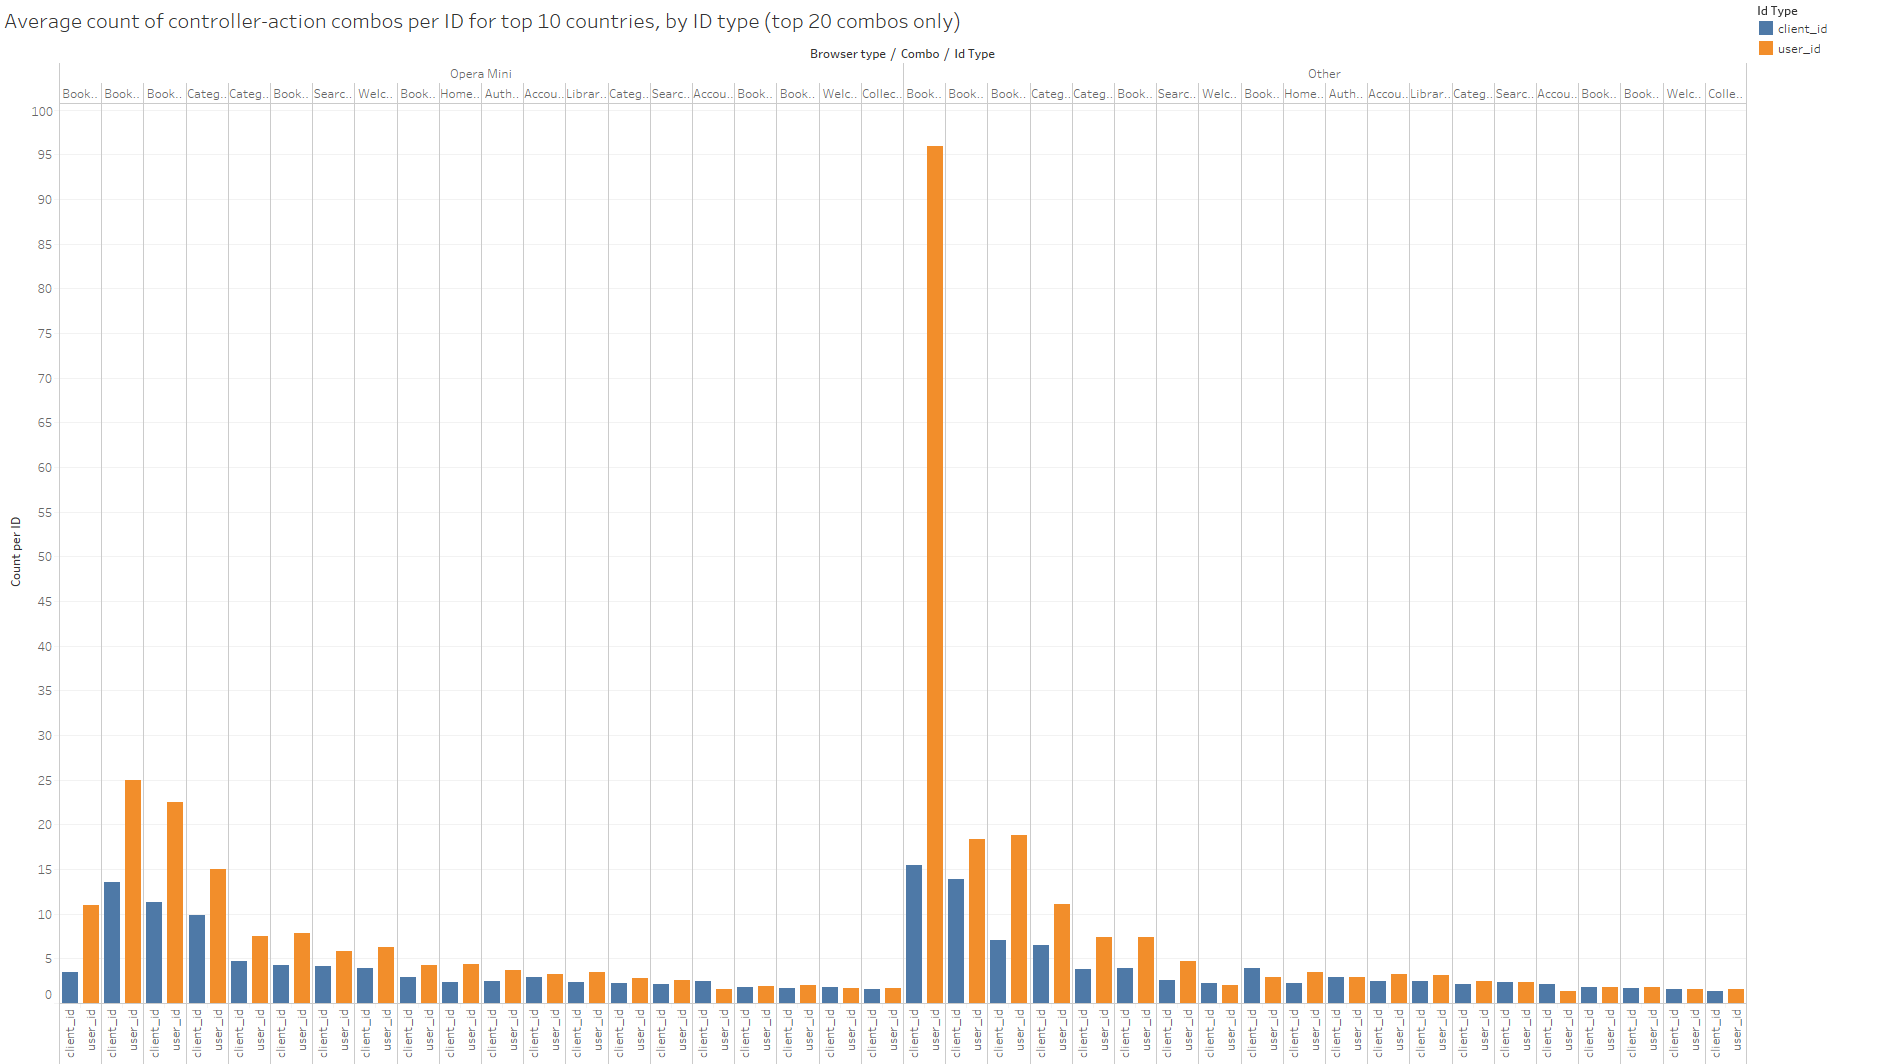
Figure 2.
It is immediately clear that on average, registered users have higher counts almost across the board for the different event types and for both browser categories.
A fascinating addition to the analysis came recently when Bree found a Python package to parse the user agent strings stored in the log data into browser type and family, OS type, phone type, and a bunch of other interesting categories. The package is a bit outdated, so probably misses some of the newer phone types, but in spite of that provides a way to at least start the analysis of different types of technology and how they access Worldreader. This could be especially interesting to compare on a country-by-country basis with other connectivity indicators, such as 3G and above coverage, but for now we focus on summarizing all countries together and leave the deeper analysis for future work.
First looking at new users per month by browser type shows that, with some variability, most are using Opera Mini (Figure 3). There is a spike in other browser types in early 2017 which then seems to taper off. There is likely some overestimation of new user counts, since calculations for unregistered users are using new client_ids, which are known to change sometimes even for the same device.
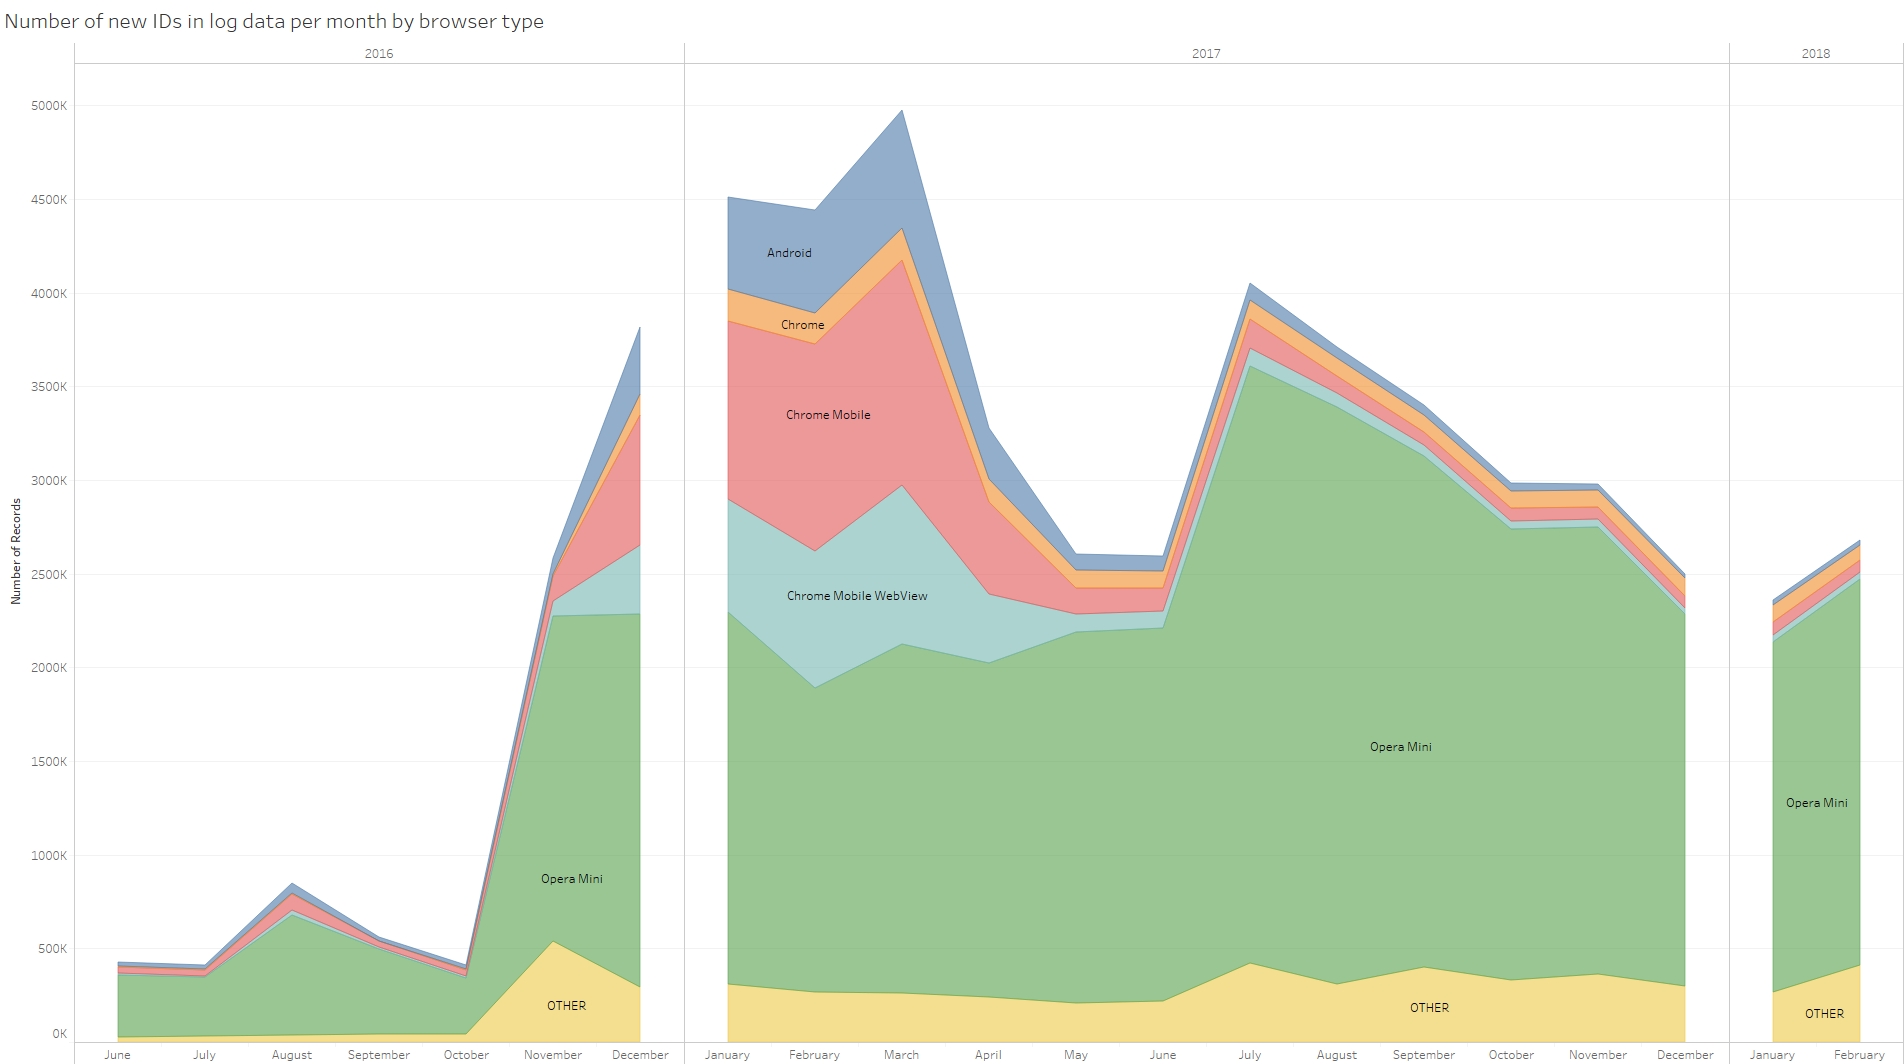
Figure 3.
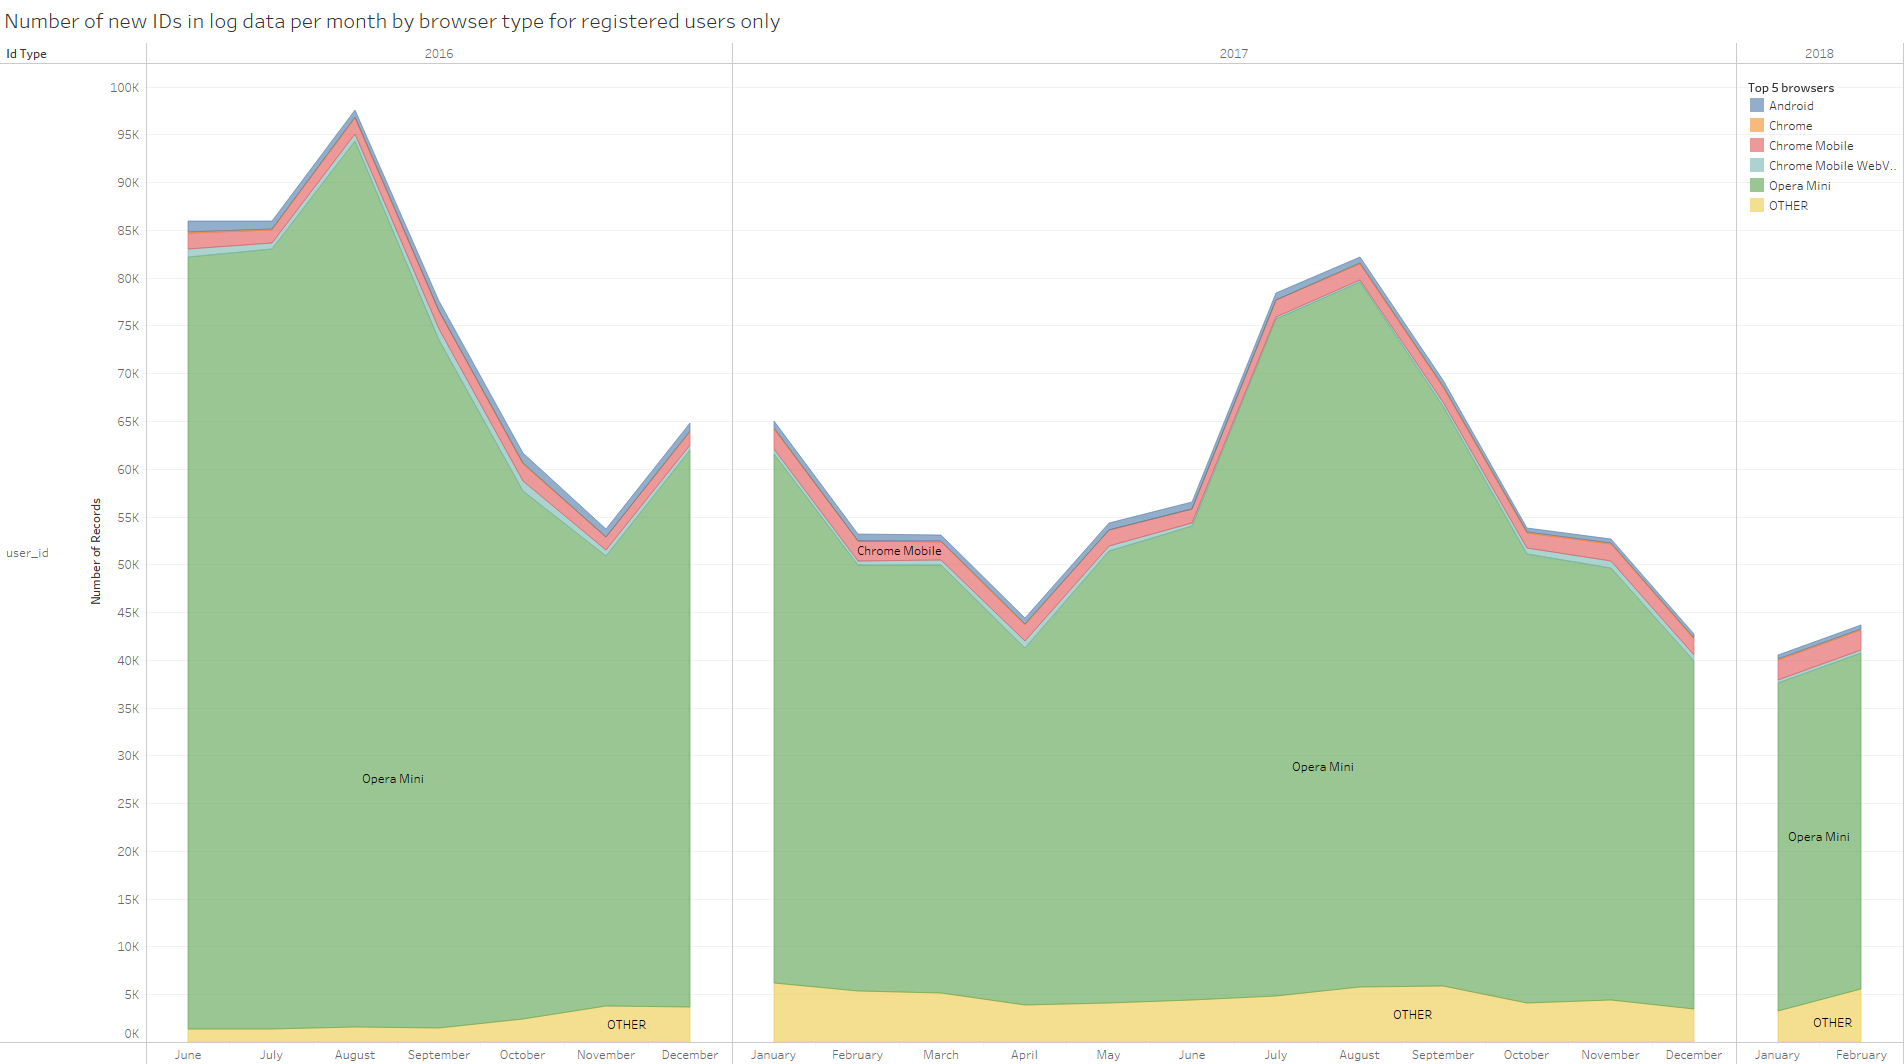
Looking at just registered users (Figure 4), showing new users by month for different browser types, shows again that the majority start using Worldreader via Opera Mini.
Figure 4.
This analysis gives us some very initial insights into the behaviors of Worldreader users. We found that registered users make up a very small proportion of the total users, but that they are also much more active on the application. It is unclear whether increased activity leads users to register for the application, or whether the functionality that comes along with registration (such as being able to save one’s place in a book) leads users to become more active. Future work might try to use client ID’s to track whether individuals tend to use the application for awhile prior to registering the application, to shed some light on the directionality of this relationship between registration and usage levels. These insights might help us to understand whether the functionality provided by registration leads to increased usage, or if increased usage leads to a desire to register.
We also found that new registered users vastly prefer Opera Mini as a browser for interacting with the application. This makes sense given that Worldreader has put a great deal of effort into optimizing their application for Opera Mini, but may also indicate that users are coming from low-connectivity environments or are concerned about data costs. One of the most intriguing findings was the large spike in new, unregistered users, largely using non-Opera Mini browsers, in November 2016. It would be interesting to try to tie this spike in users to events related to the Worldreader app, such as advertisement across various app stores. This may help develop an understanding of successful strategies for attracting new users. As mentioned above, it would also be interesting to look for correlations between browser type and country.
The next two posts will build on these initial findings around usage. The second post will explore the more granular journeys that users take through the application, while the third looks at selection of books by genre.
All of the data has been anonymized and has no features to allow us to track IDs to specific individuals, in compliance with privacy laws. ↩