Posted February 22, 2018
By Bree Norlander
In the article, “Creating a Data Analysis Plan: What to Consider When Choosing Statistics for a Study,” Scot Simpson states that “the first step in a data analysis plan is to describe the data collected in the study” (2015 p. 312). In a previous blog post, Lucas outlined the data variables in our dataset. With those variables in mind, I will present some descriptive statistics of our overall data, and two smaller segments of the overall data.
We are initially focusing on a static dataset which includes all activity from June 1, 2016 through November 30, 2017. By choosing a static set of data we can be sure that all members of the team are working on the same data.
The static dataset contains 558,548,651 rows (each row is an action taken by a user) and uncompressed takes up 316.4GB of space. We are currently evaluating the best options for sharing data of this size amongst the team and will address our process in a later blog post.
As Lucas mentioned in the data variables blog post, each device is assigned a client_id number. It is important to note that the client_id number is not an accurate representation of unique users. Worldreader users may share devices amongst several people, they may sell/trade their device, or their device may register a new client_id for a variety of different hardware/software-related reasons.
With those caveats in mind, our dataset contains 62,463,086 unique client_ids. Of those, 871,020 have unique user_ids. User_ids indicate that a user has registered either by logging in with Facebook, Google, or by creating a username and password. Registration is not required but allows users to save information about the books they are reading and create a library of titles. As researchers, we value registered users because they are easier to track in the data. Unlike client_ids, user_ids should be consistent over time (assuming a registered user always logs in to use Worldreader and does not share their registration account with other users). Registered users often provide some demographic data in the form of gender and/or age which helps us more readily understand the Worldreader user base and may allow us to pursue social science questions related to age and gender and the use of mobile reading technologies. However, and this is a big caveat, no matter how many users register, we are still drawing from a convenience sample of users who choose to interact with Worldreader. Convenience samples make it difficult, if not impossible, to generalize to the greater population. See more regarding sampling in Jason’s earlier post on big data.
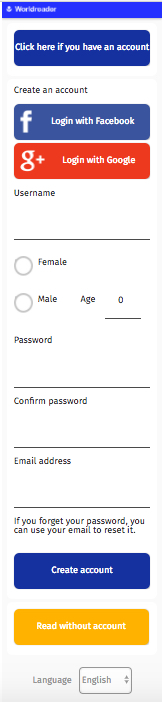
A screenshot of the Worldreader Mobile Website's Sign In Screen. December 2017.
In a Forbes article, “Big Data Analytics: First Steps,” Meta Brown wisely wrote, “The way to approach a big data problem is to split it into little data problems first. The process for analyzing big data is the same as the process for eating an elephant; you do it one bite at a time” (2015). Our first bite was the approximately 1% of devices being used by registered users. This was a useful first chunk of data because we could rely upon the stability of user_ids over time and we had some demographic information to work with. This is the only sample of data in which we can explore demographics of Worldreader users. Here is what we’ve found from this select group:
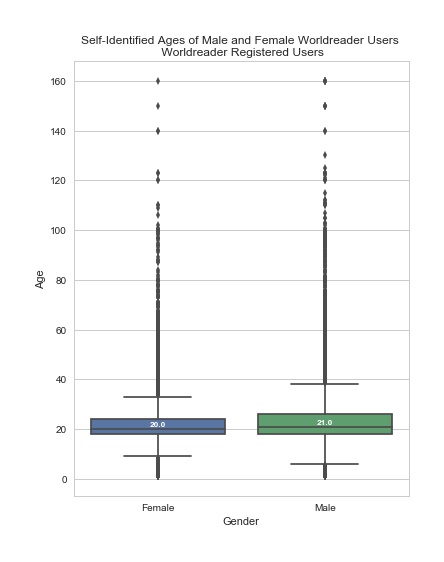
Plot created with matplotlib 2.0.2 and seaborn 0.7.1 in Python 3.5.3.
Yes, you read the age range correctly. While it might be that there are many more 160-year-olds living on the planet than we previously knew, it’s probably more likely that many of the input ages are not accurate. A quick search for data regarding the accuracy of demographics in online registration reveals that this information can be highly unreliable (see for example: Kemp 2017; Aimee 2017; McCarthy 2017; Goings and Abel n.d.; Soni 2017). Ages were gathered from users who created an account with Worldreader and chose to provide their age. The Worldreader registration input box errors with any age over 160. Ages are recorded in whole numbers rather than calculated from a birthdate. This field is static and does not change over time unless a user updates their profile information. For all of the above reasons, we will need to be cautious about any observations we make from the age variable and the gender variable.
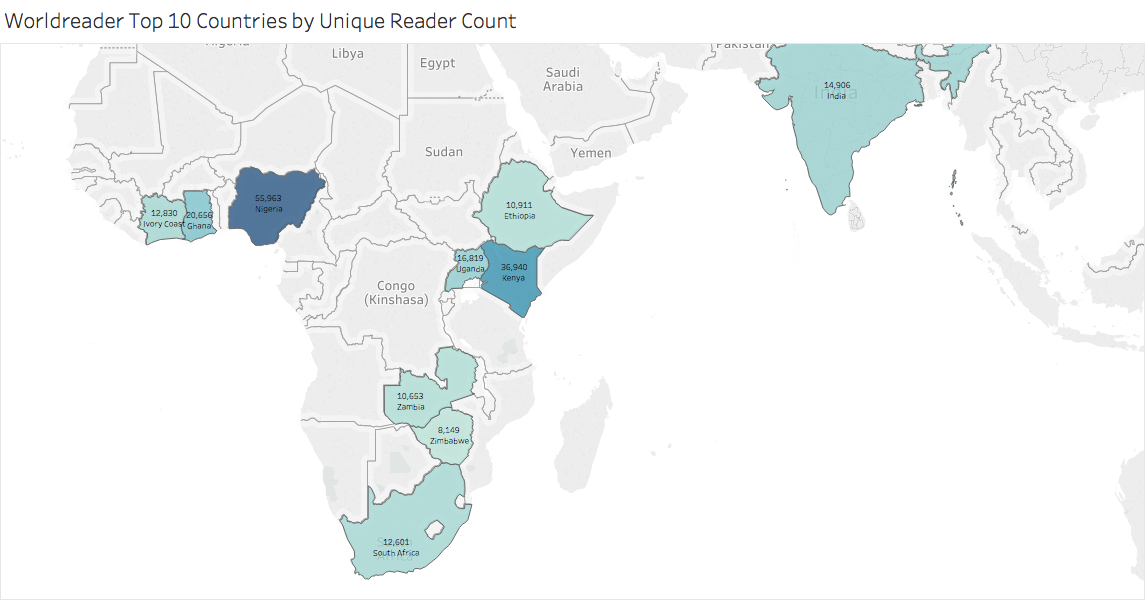
One of the important aspects of analyzing large datasets is to understand the context or information landscape from which the data is being gathered. Researching the literacy landscape of 197 countries is unmanageable within the short timeframe of this study. We decided to focus on the top 10 countries. To determine the top ten countries, we used the registered users data to pull out the count of unique user_ids where a user_id was classified as a “Reader.” This is the method Worldreader uses to count users in a given country. (Classification as reader varies slightly by country but in general a user_id account holder must have viewed at least two pages of a book on a single day.) Below are the top 10 countries and the counts of registered user_ids:
| Country | Count of Unique Readers |
|---|---|
| Nigeria | 55,963 |
| Kenya | 36,940 |
| Ghana | 20,656 |
| Uganda | 16,819 |
| Côte d'Ivoire | 12,830 |
| India | 14,906 |
| South Africa | 12,601 |
| Ethiopia | 10,911 |
| Zambia | 10,653 |
| Zimbabwe | 8,149 |
Map created with Tableau Desktop 10.4.
It might also make sense to normalize the number of readers by population, to recognize that countries with larger overall populations are also likely to have relatively more Worldreader users. In the table below we calculated the top 10 countries based on readers per capita (see the variables readers_per_pop and readers_per_100,000), using UN data from 2013. It does affect which countries make the top ten. However, our team wanted to focus on larger populations of Worldreader users, so that we can base our in-country analysis on a decent number of individuals. Swaziland, at only 1,425 readers, does not meet this requirement. It’s also a priority for Worldreader to focus on larger populations of their users. We’ve therefore decided to target the raw count data rather than per capita data.
| Country | Count of Unique Readers | 2013 Population | Readers Per Population | Readers per 100,000 |
|---|---|---|---|---|
| Swaziland | 1,294 | 1,271,456 | 0.001018 | 101.773 |
| Kenya | 36,940 | 44,826,849 | 0.000824 | 82.406 |
| Ghana | 20,656 | 26,346,251 | 0.000784 | 78.402 |
| Namibia | 1,684 | 2,316,520 | 0.000727 | 72.695 |
| Zambia | 10,653 | 15,153,210 | 0.000703 | 70.302 |
| Zimbabwe | 8,149 | 15,054,506 | 0.000541 | 54.13 |
| Benin | 5,252 | 10,004,451 | 0.000525 | 52.497 |
| Uganda | 16,819 | 37,553,726 | 0.000448 | 44.787 |
| Botswana | 851 | 2,128,507 | 0.000400 | 39.981 |
| Cameroon | 8,136 | 21,655,715 | 0.000376 | 37.57 |
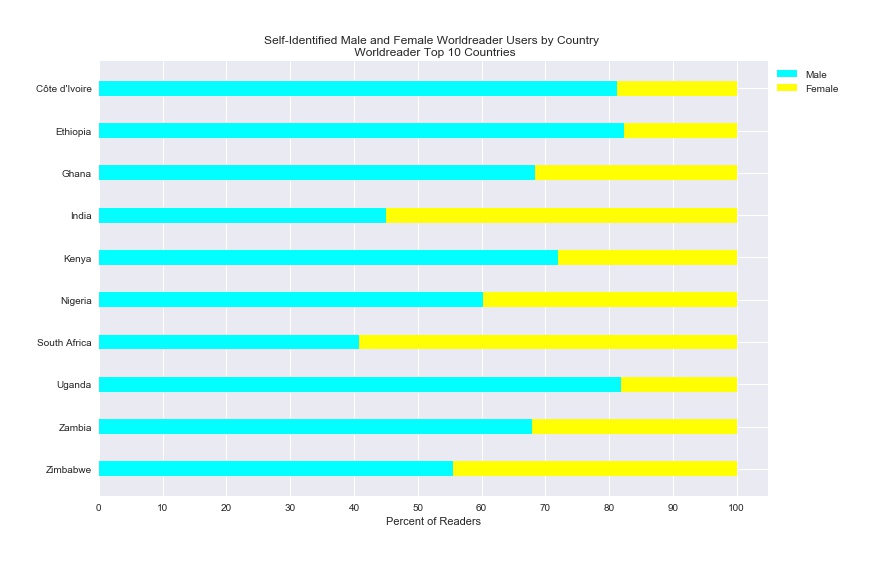
Within the top ten countries by count, here are the statistics:
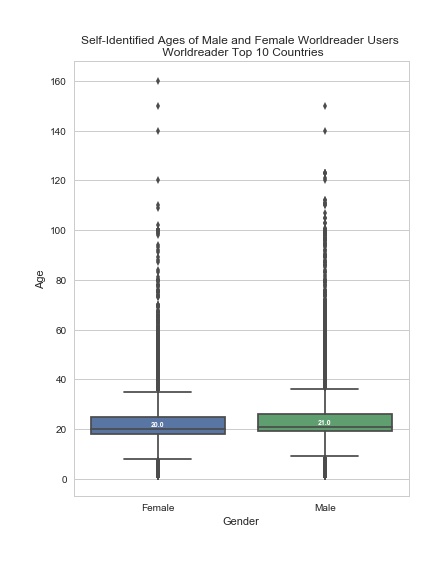
Plot created with matplotlib 2.0.2 and seaborn 0.7.1 in Python 3.5.3.
Plot created with matplotlib 2.0.2 in Python 3.5.3.
In conclusion, summary statistics are useful for gaining a broad perspective on a dataset. When faced with a large dataset like ours, it is necessary to break the dataset into smaller pieces. Deciding how to slice and dice a dataset will be a team decision based on the size and available variables. For example, we chose to look at the top ten countries. This was an arbitrary decision but felt right to the team. We also needed to define “top 10” to determine how we would retrieve that slice of the data.
These early exploratory analyses are also useful in that they help us to generate new questions about the dataset, which can direct additional, more targeted rounds of analysis. For example, some of the discrepancies related to the self-reported age of users raises questions about the veracity of our data. This has led us to think more about the context of our data, and to perform additional research on big data, demographic information, and reliability. This has further encouraged us to perform additional tests of the log data against real-world uses of the application. Second, there is variability across the top ten countries in terms of the gender of registered users, which leads to interesting questions about digital access and gender inequalities. Why is it that South Africa and India have a higher relative percentage of women users, compared to the other top 10? Is the gender disparity in the other countries a result of hardware access (i.e., women don’t have as much access to phones), time (i.e., women are too busy taking care of gendered roles), education, stigma around technology use (that either prevents them from using the application, or just prevents them from registering), or something else altogether? In order to examine these dimensions more, we are working on country-specific dashboards that will allow users to compare Worldreader data with other datasets on development. And, these are just two areas of questioning presented by these summary statistics! You can expect posts on these new areas soon!